Surveying & Built Environment Vol. 22 Issue 1 (December 2012)
Surveying & Built Environment Vol. 22 Issue 1 (December 2012)
Surveying & Built Environment Vol. 22 Issue 1 (December 2012)

Create successful ePaper yourself
Turn your PDF publications into a flip-book with our unique Google optimized e-Paper software.
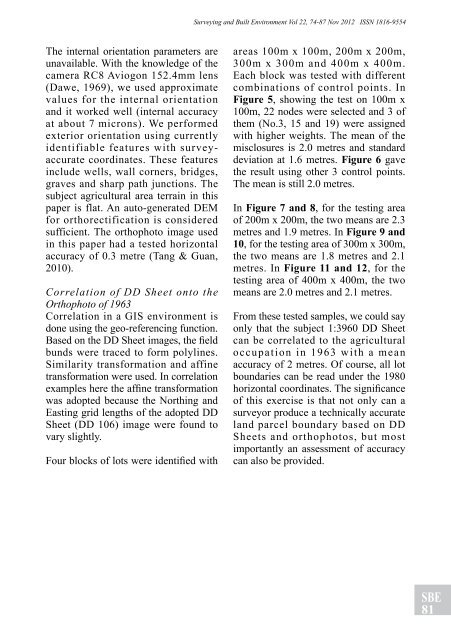
The internal orientation parameters are<br />
unavailable. With the knowledge of the<br />
camera RC8 Aviogon 152.4mm lens<br />
(Dawe, 1969), we used approximate<br />
values for the internal orientation<br />
and it worked well (internal accuracy<br />
at about 7 microns). We performed<br />
exterior orientation using currently<br />
identifiable features with surveyaccurate<br />
coordinates. These features<br />
include wells, wall corners, bridges,<br />
graves and sharp path junctions. The<br />
subject agricultural area terrain in this<br />
paper is flat. An auto-generated DEM<br />
for orthorectification is considered<br />
sufficient. The orthophoto image used<br />
in this paper had a tested horizontal<br />
accuracy of 0.3 metre (Tang & Guan,<br />
2010).<br />
Correlation of DD Sheet onto the<br />
Orthophoto of 1963<br />
Correlation in a GIS environment is<br />
done using the geo-referencing function.<br />
Based on the DD Sheet images, the field<br />
bunds were traced to form polylines.<br />
Similarity transformation and affine<br />
transformation were used. In correlation<br />
examples here the affine transformation<br />
was adopted because the Northing and<br />
Easting grid lengths of the adopted DD<br />
Sheet (DD 106) image were found to<br />
vary slightly.<br />
Four blocks of lots were identified with<br />
<strong>Surveying</strong> and <strong>Built</strong> <strong>Environment</strong> <strong>Vol</strong> <strong>22</strong>, 74-87 Nov <strong>2012</strong> ISSN 1816-9554<br />
areas 100m x 100m, 200m x 200m,<br />
300m x 300m and 400m x 400m.<br />
Each block was tested with different<br />
combinations of control points. In<br />
figure 5, showing the test on 100m x<br />
100m, <strong>22</strong> nodes were selected and 3 of<br />
them (No.3, 15 and 19) were assigned<br />
with higher weights. The mean of the<br />
misclosures is 2.0 metres and standard<br />
deviation at 1.6 metres. figure 6 gave<br />
the result using other 3 control points.<br />
The mean is still 2.0 metres.<br />
In figure 7 and 8, for the testing area<br />
of 200m x 200m, the two means are 2.3<br />
metres and 1.9 metres. In figure 9 and<br />
10, for the testing area of 300m x 300m,<br />
the two means are 1.8 metres and 2.1<br />
metres. In figure 11 and 12, for the<br />
testing area of 400m x 400m, the two<br />
means are 2.0 metres and 2.1 metres.<br />
From these tested samples, we could say<br />
only that the subject 1:3960 DD Sheet<br />
can be correlated to the agricultural<br />
occupation in 1963 with a mean<br />
accuracy of 2 metres. Of course, all lot<br />
boundaries can be read under the 1980<br />
horizontal coordinates. The significance<br />
of this exercise is that not only can a<br />
surveyor produce a technically accurate<br />
land parcel boundary based on DD<br />
Sheets and orthophotos, but most<br />
importantly an assessment of accuracy<br />
can also be provided.<br />
SBE<br />
81