

printmgr file - Templeton
printmgr file - Templeton
printmgr file - Templeton

You also want an ePaper? Increase the reach of your titles
YUMPU automatically turns print PDFs into web optimized ePapers that Google loves.
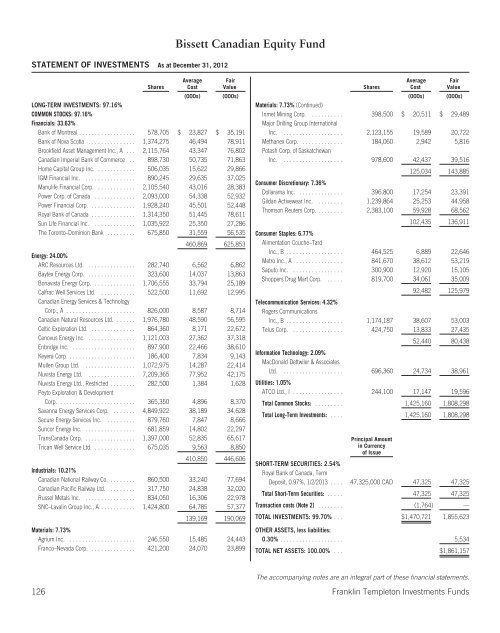
STATEMENT OF INVESTMENTS As at December 31, 2012<br />
Bissett Canadian Equity Fund<br />
Average<br />
Cost<br />
Fair<br />
Value<br />
Shares<br />
(000s) (000s)<br />
LONG-TERM INVESTMENTS: 97.16%<br />
COMMON STOCKS: 97.16%<br />
Financials: 33.63%<br />
Bank of Montreal . . ................ 578,705 $ 23,827 $ 35,191<br />
Bank of Nova Scotia ............... 1,374,275 46,494 78,911<br />
Brookfield Asset Management Inc., A . . . 2,115,764 43,347 76,802<br />
Canadian Imperial Bank of Commerce . . 898,730 50,735 71,863<br />
Home Capital Group Inc. ............ 506,035 15,622 29,866<br />
IGM Financial Inc. ................ 890,245 29,635 37,025<br />
Manulife Financial Corp. ............ 2,105,540 43,016 28,383<br />
Power Corp. of Canada ............. 2,093,000 54,338 52,932<br />
Power Financial Corp. .............. 1,928,240 45,501 52,448<br />
Royal Bank of Canada .............. 1,314,350 51,445 78,611<br />
Sun Life Financial Inc. ............. 1,035,922 25,350 27,286<br />
The Toronto–Dominion Bank ......... 675,850 31,559 56,535<br />
460,869 625,853<br />
Energy: 24.00%<br />
ARC Resources Ltd. ............... 282,740 6,562 6,862<br />
Baytex Energy Corp. ............... 323,600 14,037 13,863<br />
Bonavista Energy Corp. ............. 1,706,555 33,794 25,189<br />
Calfrac Well Services Ltd. ........... 522,500 11,692 12,995<br />
Canadian Energy Services & Technology<br />
Corp., A ...................... 826,000 8,587 8,714<br />
Canadian Natural Resources Ltd. ...... 1,976,780 48,590 56,595<br />
Celtic Exploration Ltd. .............. 864,360 8,171 22,672<br />
Cenovus Energy Inc. ............... 1,121,003 27,362 37,318<br />
Enbridge Inc. . . .................. 897,900 22,466 38,610<br />
Keyera Corp. . . . .................. 186,400 7,834 9,143<br />
Mullen Group Ltd. ................ 1,072,975 14,287 22,414<br />
Nuvista Energy Ltd. ............... 7,209,365 77,952 42,175<br />
Nuvista Energy Ltd., Restricted ........ 282,500 1,384 1,628<br />
Peyto Exploration & Development<br />
Corp. . . ...................... 365,350 4,896 8,370<br />
Savanna Energy Services Corp. ....... 4,849,922 38,189 34,628<br />
Secure Energy Services Inc. ......... 879,760 7,847 8,666<br />
Suncor Energy Inc. ................ 681,859 14,802 22,297<br />
TransCanada Corp. ................ 1,397,000 52,835 65,617<br />
Trican Well Service Ltd. ............. 675,035 9,563 8,850<br />
410,850 446,606<br />
Industrials: 10.21%<br />
Canadian National Railway Co. ........ 860,500 33,240 77,694<br />
Canadian Pacific Railway Ltd. ........ 317,750 24,838 32,020<br />
Russel Metals Inc. ................ 834,050 16,306 22,978<br />
SNC–Lavalin Group Inc., A ........... 1,424,800 64,785 57,377<br />
139,169 190,069<br />
Materials: 7.73%<br />
Agrium Inc. . . . .................. 246,550 15,485 24,443<br />
Franco–Nevada Corp. .............. 421,200 24,070 23,899<br />
Average<br />
Cost<br />
Fair<br />
Value<br />
Shares<br />
(000s) (000s)<br />
Materials: 7.73% (Continued)<br />
Inmet Mining Corp. .......... 398,500 $ 20,511 $ 29,489<br />
Major Drilling Group International<br />
Inc. ................... 2,123,155 19,589 20,722<br />
Methanex Corp. ............. 184,060 2,942 5,816<br />
Potash Corp. of Saskatchewan<br />
Inc. ................... 978,600 42,437 39,516<br />
125,034 143,885<br />
Consumer Discretionary: 7.36%<br />
Dollarama Inc. .............. 396,800 17,254 23,391<br />
Gildan Activewear Inc. ........ 1,239,864 25,253 44,958<br />
Thomson Reuters Corp. ........ 2,383,100 59,928 68,562<br />
102,435 136,911<br />
Consumer Staples: 6.77%<br />
Alimentation Couche–Tard<br />
Inc., B .................. 464,525 6,889 22,646<br />
Metro Inc., A ............... 841,670 38,612 53,219<br />
Saputo Inc. . ............... 300,900 12,920 15,105<br />
Shoppers Drug Mart Corp. ..... 819,700 34,061 35,009<br />
92,482 125,979<br />
Telecommunication Services: 4.32%<br />
Rogers Communications<br />
Inc., B .................. 1,174,187 38,607 53,003<br />
Telus Corp. . ............... 424,750 13,833 27,435<br />
52,440 80,438<br />
Information Technology: 2.09%<br />
MacDonald Dettwiler & Associates<br />
Ltd. ................... 696,360 24,734 38,961<br />
Utilities: 1.05%<br />
ATCO Ltd., I . ............... 244,100 17,147 19,596<br />
Total Common Stocks: ......... 1,425,160 1,808,298<br />
Total Long-Term Investments: .... 1,425,160 1,808,298<br />
Principal Amount<br />
in Currency<br />
of Issue<br />
SHORT-TERM SECURITIES: 2.54%<br />
Royal Bank of Canada, Term<br />
Deposit, 0.97%, 1/2/2013 .... 47,325,000 CAD 47,325 47,325<br />
Total Short-Term Securities: ..... 47,325 47,325<br />
Transaction costs (Note 2) ........ (1,764) —<br />
TOTAL INVESTMENTS: 99.70% ... $1,470,721 1,855,623<br />
OTHER ASSETS, less liabilities:<br />
0.30% .................... 5,534<br />
TOTAL NET ASSETS: 100.00% ... $1,861,157<br />
The accompanying notes are an integral part of these financial statements.<br />
126 Franklin <strong>Templeton</strong> Investments Funds


