Microbiology and Spoilage Trail in Nile Perch (Lates niloticus), Lake ...
Microbiology and Spoilage Trail in Nile Perch (Lates niloticus), Lake ...
Microbiology and Spoilage Trail in Nile Perch (Lates niloticus), Lake ...

You also want an ePaper? Increase the reach of your titles
YUMPU automatically turns print PDFs into web optimized ePapers that Google loves.
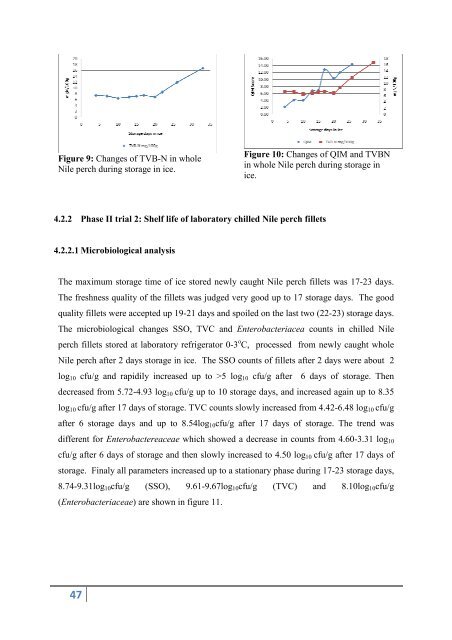
Figure 9: Changes of TVB-N <strong>in</strong> whole<br />
<strong>Nile</strong> perch dur<strong>in</strong>g storage <strong>in</strong> ice.<br />
47<br />
Figure 10: Changes of QIM <strong>and</strong> TVBN<br />
<strong>in</strong> whole <strong>Nile</strong> perch dur<strong>in</strong>g storage <strong>in</strong><br />
ice.<br />
4.2.2 Phase II trial 2: Shelf life of laboratory chilled <strong>Nile</strong> perch fillets<br />
4.2.2.1 Microbiological analysis<br />
The maximum storage time of ice stored newly caught <strong>Nile</strong> perch fillets was 17-23 days.<br />
The freshness quality of the fillets was judged very good up to 17 storage days. The good<br />
quality fillets were accepted up 19-21 days <strong>and</strong> spoiled on the last two (22-23) storage days.<br />
The microbiological changes SSO, TVC <strong>and</strong> Enterobacteriacea counts <strong>in</strong> chilled <strong>Nile</strong><br />
perch fillets stored at laboratory refrigerator 0-3 o C, processed from newly caught whole<br />
<strong>Nile</strong> perch after 2 days storage <strong>in</strong> ice. The SSO counts of fillets after 2 days were about 2<br />
log10 cfu/g <strong>and</strong> rapidily <strong>in</strong>creased up to >5 log10 cfu/g after 6 days of storage. Then<br />
decreased from 5.72-4.93 log10 cfu/g up to 10 storage days, <strong>and</strong> <strong>in</strong>creased aga<strong>in</strong> up to 8.35<br />
log10 cfu/g after 17 days of storage. TVC counts slowly <strong>in</strong>creased from 4.42-6.48 log10 cfu/g<br />
after 6 storage days <strong>and</strong> up to 8.54log10cfu/g after 17 days of storage. The trend was<br />
different for Enterobactereaceae which showed a decrease <strong>in</strong> counts from 4.60-3.31 log10<br />
cfu/g after 6 days of storage <strong>and</strong> then slowly <strong>in</strong>creased to 4.50 log10 cfu/g after 17 days of<br />
storage. F<strong>in</strong>aly all parameters <strong>in</strong>creased up to a stationary phase dur<strong>in</strong>g 17-23 storage days,<br />
8.74-9.31log10cfu/g (SSO), 9.61-9.67log10cfu/g (TVC) <strong>and</strong> 8.10log10cfu/g<br />
(Enterobacteriaceae) are shown <strong>in</strong> figure 11.