Microbiology and Spoilage Trail in Nile Perch (Lates niloticus), Lake ...
Microbiology and Spoilage Trail in Nile Perch (Lates niloticus), Lake ...
Microbiology and Spoilage Trail in Nile Perch (Lates niloticus), Lake ...

You also want an ePaper? Increase the reach of your titles
YUMPU automatically turns print PDFs into web optimized ePapers that Google loves.
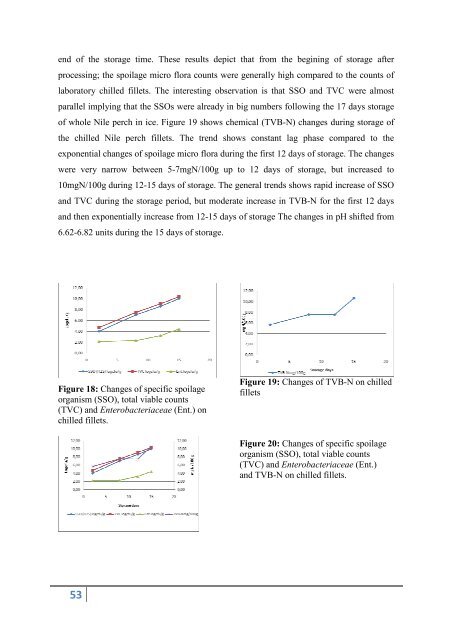
end of the storage time. These results depict that from the beg<strong>in</strong><strong>in</strong>g of storage after<br />
process<strong>in</strong>g; the spoilage micro flora counts were generally high compared to the counts of<br />
laboratory chilled fillets. The <strong>in</strong>terest<strong>in</strong>g observation is that SSO <strong>and</strong> TVC were almost<br />
parallel imply<strong>in</strong>g that the SSOs were already <strong>in</strong> big numbers follow<strong>in</strong>g the 17 days storage<br />
of whole <strong>Nile</strong> perch <strong>in</strong> ice. Figure 19 shows chemical (TVB-N) changes dur<strong>in</strong>g storage of<br />
the chilled <strong>Nile</strong> perch fillets. The trend shows constant lag phase compared to the<br />
exponential changes of spoilage micro flora dur<strong>in</strong>g the first 12 days of storage. The changes<br />
were very narrow between 5-7mgN/100g up to 12 days of storage, but <strong>in</strong>creased to<br />
10mgN/100g dur<strong>in</strong>g 12-15 days of storage. The general trends shows rapid <strong>in</strong>crease of SSO<br />
<strong>and</strong> TVC dur<strong>in</strong>g the storage period, but moderate <strong>in</strong>crease <strong>in</strong> TVB-N for the first 12 days<br />
<strong>and</strong> then exponentially <strong>in</strong>crease from 12-15 days of storage The changes <strong>in</strong> pH shifted from<br />
6.62-6.82 units dur<strong>in</strong>g the 15 days of storage.<br />
Figure 18: Changes of specific spoilage<br />
organism (SSO), total viable counts<br />
(TVC) <strong>and</strong> Enterobacteriaceae (Ent.) on<br />
chilled fillets.<br />
53<br />
Figure 19: Changes of TVB-N on chilled<br />
fillets<br />
Figure 20: Changes of specific spoilage<br />
organism (SSO), total viable counts<br />
(TVC) <strong>and</strong> Enterobacteriaceae (Ent.)<br />
<strong>and</strong> TVB-N on chilled fillets.