Microbiology and Spoilage Trail in Nile Perch (Lates niloticus), Lake ...
Microbiology and Spoilage Trail in Nile Perch (Lates niloticus), Lake ...
Microbiology and Spoilage Trail in Nile Perch (Lates niloticus), Lake ...

You also want an ePaper? Increase the reach of your titles
YUMPU automatically turns print PDFs into web optimized ePapers that Google loves.
4.3.2.4 Establishment E4 – chilled fillets (5 days iced whole <strong>Nile</strong> perch)<br />
Chilled <strong>Nile</strong> perch fillets were processed from a lot of whole <strong>Nile</strong> perch stored <strong>in</strong> ice for 5<br />
days. Changes for spoilage bacteria on chilled fillets were constant up to 13 storage days<br />
(figure 24 <strong>and</strong> 25). The trend was characterised by an <strong>in</strong>crease for both SSO <strong>and</strong> TVC <strong>in</strong><br />
parralel <strong>and</strong> reached a stationary phase after 13-15 storage days. The changes <strong>in</strong> TVB-N<br />
showed moderate <strong>in</strong>crease from the beg<strong>in</strong>n<strong>in</strong>g up to 13 days <strong>and</strong> then very rapid <strong>in</strong>crease<br />
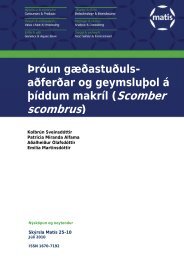
between days 13-15. The SSO <strong>and</strong> TVC <strong>in</strong>creased from 3-7log10cfu/g <strong>in</strong> the first 10 days of<br />
storage <strong>and</strong> to 9 log10 cfu/g after 15 days while the Enterobacteriaceae counts gave only a<br />
slight <strong>in</strong>crease from 2.5-3.7 log10 cfu/g. Aga<strong>in</strong> these results <strong>in</strong>dicate that the SSO counts are<br />
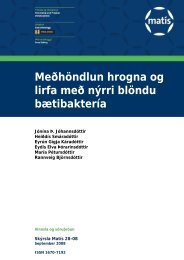
closely equals to TVC counts between 13-15 storage days. The chemical (TVB-N) changes<br />
dur<strong>in</strong>g 15 days storage of chilled <strong>Nile</strong> perch fillets show an <strong>in</strong>crease from about 5-<br />
13mgN/100g up to 15 storage days (figure 25 <strong>and</strong> 26). The changes <strong>in</strong> pH shifted from 6.5-<br />
6.9 units dur<strong>in</strong>g 15 storage days.<br />
Figure 24: Changes of specific spoilage<br />
organism (SSO), total viable counts<br />
(TVC) <strong>and</strong> Enterobacteriaceae (Ent.) on<br />
chilled fillets.<br />
55<br />
Figure 25: Changes of TVB-N on chilled<br />
fillets.<br />
Figure 26: Changes of specific spoilage<br />
organism (SSO), total viable counts<br />
(TVC), Enterobacteriaceae (Ent.) <strong>and</strong><br />
TVB-N on chilled fillets.