Microbiology and Spoilage Trail in Nile Perch (Lates niloticus), Lake ...
Microbiology and Spoilage Trail in Nile Perch (Lates niloticus), Lake ...
Microbiology and Spoilage Trail in Nile Perch (Lates niloticus), Lake ...

You also want an ePaper? Increase the reach of your titles
YUMPU automatically turns print PDFs into web optimized ePapers that Google loves.
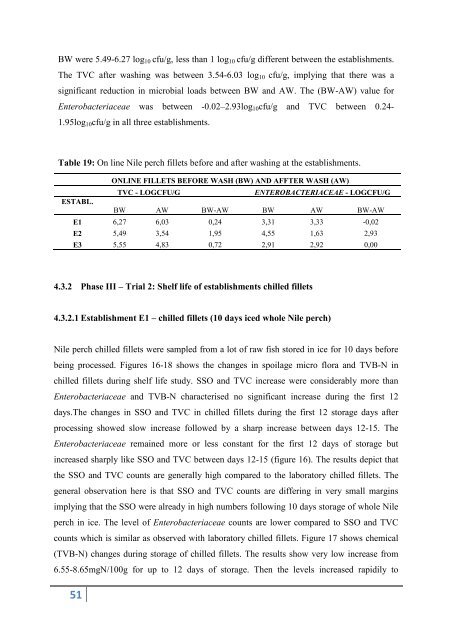
BW were 5.49-6.27 log10 cfu/g, less than 1 log10 cfu/g different between the establishments.<br />
The TVC after wash<strong>in</strong>g was between 3.54-6.03 log10 cfu/g, imply<strong>in</strong>g that there was a<br />
significant reduction <strong>in</strong> microbial loads between BW <strong>and</strong> AW. The (BW-AW) value for<br />
Enterobacteriaceae was between -0.02–2.93log10cfu/g <strong>and</strong> TVC between 0.24-<br />
1.95log10cfu/g <strong>in</strong> all three establishments.<br />
Table 19: On l<strong>in</strong>e <strong>Nile</strong> perch fillets before <strong>and</strong> after wash<strong>in</strong>g at the establishments.<br />
ESTABL.<br />
51<br />
ONLINE FILLETS BEFORE WASH (BW) AND AFFTER WASH (AW)<br />
TVC - LOGCFU/G ENTEROBACTERIACEAE - LOGCFU/G<br />
BW AW BW-AW BW AW BW-AW<br />
E1 6,27 6,03 0,24 3,31 3,33 -0,02<br />
E2 5,49 3,54 1,95 4,55 1,63 2,93<br />
E3 5,55 4,83 0,72 2,91 2,92 0,00<br />
4.3.2 Phase III – Trial 2: Shelf life of establishments chilled fillets<br />
4.3.2.1 Establishment E1 – chilled fillets (10 days iced whole <strong>Nile</strong> perch)<br />
<strong>Nile</strong> perch chilled fillets were sampled from a lot of raw fish stored <strong>in</strong> ice for 10 days before<br />
be<strong>in</strong>g processed. Figures 16-18 shows the changes <strong>in</strong> spoilage micro flora <strong>and</strong> TVB-N <strong>in</strong><br />
chilled fillets dur<strong>in</strong>g shelf life study. SSO <strong>and</strong> TVC <strong>in</strong>crease were considerably more than<br />
Enterobacteriaceae <strong>and</strong> TVB-N characterised no significant <strong>in</strong>crease dur<strong>in</strong>g the first 12<br />
days.The changes <strong>in</strong> SSO <strong>and</strong> TVC <strong>in</strong> chilled fillets dur<strong>in</strong>g the first 12 storage days after<br />
process<strong>in</strong>g showed slow <strong>in</strong>crease followed by a sharp <strong>in</strong>crease between days 12-15. The<br />
Enterobacteriaceae rema<strong>in</strong>ed more or less constant for the first 12 days of storage but<br />
<strong>in</strong>creased sharply like SSO <strong>and</strong> TVC between days 12-15 (figure 16). The results depict that<br />
the SSO <strong>and</strong> TVC counts are generally high compared to the laboratory chilled fillets. The<br />
general observation here is that SSO <strong>and</strong> TVC counts are differ<strong>in</strong>g <strong>in</strong> very small marg<strong>in</strong>s<br />
imply<strong>in</strong>g that the SSO were already <strong>in</strong> high numbers follow<strong>in</strong>g 10 days storage of whole <strong>Nile</strong><br />
perch <strong>in</strong> ice. The level of Enterobacteriaceae counts are lower compared to SSO <strong>and</strong> TVC<br />
counts which is similar as observed with laboratory chilled fillets. Figure 17 shows chemical<br />
(TVB-N) changes dur<strong>in</strong>g storage of chilled fillets. The results show very low <strong>in</strong>crease from<br />
6.55-8.65mgN/100g for up to 12 days of storage. Then the levels <strong>in</strong>creased rapidily to