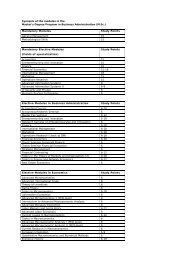
Measuring the Effects of a Shock to Monetary Policy - Humboldt ...
Measuring the Effects of a Shock to Monetary Policy - Humboldt ...
Measuring the Effects of a Shock to Monetary Policy - Humboldt ...

Create successful ePaper yourself
Turn your PDF publications into a flip-book with our unique Google optimized e-Paper software.
112 Bayesian FAVARs with Agnostic Identification<br />
end<br />
%directly called from DO_RESULTS<br />
d = size(squeeze( (results.ira.finalresponses(1).response(1,:,:))),2);<br />
draws = 1:10:d; %show every xth accepted draw response<br />
elseif k(i) == 5<br />
load FOR_MESH_K5_RESULTS;<br />
d = size(squeeze( (results.ira.finalresponses(1).response(1,:,:))),2);<br />
draws = 1:10:d;<br />
elseif k(i) == 7<br />
end<br />
load FOR_MESH_K7_RESULTS;<br />
d = size(squeeze( (results.ira.finalresponses(1).response(1,:,:))),2);<br />
draws = 1:d;<br />
disp (sprintf(’K%d data ready’,k(i)));<br />
n = input.specification.IRA.nsteps;<br />
srs = 1:size(squeeze( (results.ira.finalresponses(1).response(1,:,draws))),1);<br />
smax = size(squeeze( (results.ira.finalresponses(1).response(1,:,draws))),1);<br />
figure(k(i))<br />
axis normal;<br />
grid on;<br />
axis tight;<br />
subplot(2,2,1);<br />
mesh (squeeze(results.ira.finalresponses(1).response(1,srs,draws)));<br />
ylabel(’Horizon’);<br />
xlabel(’Accepted Response Draws’);<br />
zlabel(’Response Scale’);<br />
title (’FFR’);<br />
subplot(2,2,2);<br />
mesh (squeeze(results.ira.finalresponses(1).response(9,srs,draws)));<br />
zlabel(’Response Scale’);<br />
title (’COMMODITY PRICE INDEX’);<br />
subplot(2,2,3);<br />
mesh (squeeze(results.ira.finalresponses(1).response(14,srs,draws)));<br />
zlabel(’Response Scale’);<br />
title ( ’UNEMPLOYMENT’);<br />
subplot(2,2,4);<br />
mesh (squeeze(results.ira.finalresponses(1).response(10,srs,draws)));<br />
zlabel(’Response Scale’);<br />
title ( ’CAPACITY UTIL RATE’);<br />
saveas(gcf, sprintf ( ’FIG_MESH_K%d’ ,k(i)) , ’fig’);<br />
saveas(gcf, sprintf ( ’FIG_MESH_K%d’ ,k(i)) , ’jpg’);


![[Text eingeben] [Text eingeben] Lebenslauf Anna-Maria Schneider](https://img.yumpu.com/16300391/1/184x260/text-eingeben-text-eingeben-lebenslauf-anna-maria-schneider.jpg?quality=85)