Potomac Waterfront Flood Mitigation Study - City of Alexandria
Potomac Waterfront Flood Mitigation Study - City of Alexandria
Potomac Waterfront Flood Mitigation Study - City of Alexandria

Create successful ePaper yourself
Turn your PDF publications into a flip-book with our unique Google optimized e-Paper software.
F I N A L R E P O R T<br />
POTOMAC RIVER WATERFRONT<br />
FLOOD MITIGATION STUDY<br />
EVALUATION AND<br />
RECOMMENDATION OF<br />
MITIGATION MEASURES<br />
Prepared for<br />
The <strong>City</strong> <strong>of</strong> <strong>Alexandria</strong>, VA<br />
<strong>City</strong> Hall<br />
301 King Street<br />
<strong>Alexandria</strong>, VA 22314<br />
July 2010<br />
URS Corporation<br />
200 Orchard Ridge Drive, Suite 101<br />
Gaithersburg, MD 20878<br />
Project Number: 15298592
TABLE OF CONTENTS<br />
ACRONYMS AND ABBREVIATIONS............................................................................................................ VI<br />
EXECUTIVE SUMMARY ........................................................................................................................... ES-1<br />
SECTION ONE: INTRODUCTION................................................................................................................ 1-1<br />
1.1 <strong>Potomac</strong> River <strong>Flood</strong> <strong>Mitigation</strong> <strong>Study</strong> Overview..................................1-1<br />
1.2 Background.............................................................................................1-1<br />
1.3 <strong>Study</strong> Area..............................................................................................1-2<br />
1.4 Report Organization................................................................................1-3<br />
SECTION TWO: REFINEMENT OF MITIGATION MEASURES................................................................. 2-1<br />
2.1 Summary <strong>of</strong> Initial <strong>Flood</strong>ing Assessment ...............................................2-1<br />
2.2 List <strong>of</strong> Comprehensive <strong>Flood</strong> <strong>Mitigation</strong> Measures ................................2-4<br />
2.3 Refinement <strong>of</strong> <strong>Mitigation</strong> Options ..........................................................2-5<br />
SECTION THREE: OVERVIEW OF FLOOD MITIGATION MEASURES ................................................... 3-1<br />
3.1 Structural <strong>Mitigation</strong> Measures...............................................................3-1<br />
3.1.1 Structural <strong>Flood</strong> Barriers.............................................................3-1<br />
3.1.2 Acquire Properties ......................................................................3-2<br />
3.1.3 <strong>Flood</strong>pro<strong>of</strong>ing .............................................................................3-3<br />
3.1.4 Elevate Structures .......................................................................3-7<br />
3.1.5 Increase Inlet and Road Elevations .............................................3-7<br />
3.2 NonStructural <strong>Mitigation</strong>s ......................................................................3-8<br />
3.2.1 Improve <strong>Flood</strong>plain Zoning Ordinances......................................3-8<br />
3.2.2 Elevate Internal Supplies and Goods.........................................3-12<br />
3.2.3 Sandbagging and Other Temporary Measures...........................3-13<br />
3.3 Other Measures.....................................................................................3-14<br />
SECTION FOUR: TECHNICAL ANALYSES SUPPORT............................................................................. 4-1<br />
4.1 Existing Data ..........................................................................................4-1<br />
4.1.1 Building Elevation Data..............................................................4-1<br />
4.1.2 Field Reconnaissance..................................................................4-3<br />
4.2 Overview <strong>of</strong> Cultural Resources Context................................................4-3<br />
4.2.1 Local Protection for Historic Properties......................................4-5<br />
4.2.2 Federal Protection for Historic Properties...................................4-5<br />
4.3 Overview <strong>of</strong> Natural Resources Context.................................................4-6<br />
4.4 Repetitive Loss Properties ......................................................................4-7<br />
4.5 Consideration <strong>of</strong> Sea Level Rise.............................................................4-8<br />
SECTION FIVE: ECONOMIC VALUATION (BENEFIT-COST ANALYSIS) ............................................... 5-1<br />
5.1 Defining the Scope <strong>of</strong> Analysis ..............................................................5-1<br />
5.2 Calculation <strong>of</strong> Project Benefits ...............................................................5-2<br />
5.3 Calculation <strong>of</strong> Project Costs....................................................................5-5<br />
5.3.1 Acquisition..................................................................................5-5<br />
5.3.2 <strong>Flood</strong>pro<strong>of</strong>ing .............................................................................5-5<br />
5.3.3 Other Structural <strong>Mitigation</strong> Measures.........................................5-6<br />
SECTION SIX: STRUCTURAL MITIGATION MEASURE CONCEPTS...................................................... 6-1<br />
6.1 <strong>Flood</strong>wall................................................................................................6-1<br />
6.1.1 Description <strong>of</strong> Alternative...........................................................6-1<br />
28-JUL-10\\ i
TABLE OF CONTENTS<br />
6.1.2 Assumptions ...............................................................................6-5<br />
6.1.3 Potential Impacts.........................................................................6-7<br />
6.1.4 Permitting/Approval Requirements.............................................6-8<br />
6.1.5 BCA and Results.......................................................................6-10<br />
6.2 Elevated Walkway................................................................................6-10<br />
6.2.1 Description <strong>of</strong> Alternative.........................................................6-11<br />
6.2.2 Assumptions .............................................................................6-16<br />
6.2.3 Potential Impacts.......................................................................6-16<br />
6.2.4 Permitting/Approval Requirements...........................................6-17<br />
6.2.5 BCA and Results.......................................................................6-19<br />
6.3 Jones Point Berm..................................................................................6-19<br />
6.3.1 Description <strong>of</strong> Alternative.........................................................6-19<br />
6.3.2 Assumptions .............................................................................6-23<br />
6.3.3 Potential Impacts.......................................................................6-23<br />
6.3.4 Permitting/Approval Requirements...........................................6-23<br />
6.3.5 BCA and Results.......................................................................6-25<br />
6.4 Improve Roadway Drainage .................................................................6-25<br />
6.4.1 Description <strong>of</strong> Alternative.........................................................6-26<br />
6.4.2 Assumptions .............................................................................6-26<br />
6.4.3 Potential Impacts.......................................................................6-26<br />
6.4.4 Permitting/Approval Requirements...........................................6-28<br />
6.4.5 BCA and Results.......................................................................6-29<br />
6.5 Acquire Properties ................................................................................6-30<br />
6.5.1 Assumptions .............................................................................6-30<br />
6.5.2 Potential Impacts.......................................................................6-30<br />
6.5.3 Permitting/Approval Requirements...........................................6-30<br />
6.5.4 Applicability <strong>of</strong> Acquisition/Benefit-Cost Analysis..................6-31<br />
6.6 <strong>Flood</strong>pro<strong>of</strong>ing.......................................................................................6-33<br />
6.6.1 Assumptions .............................................................................6-33<br />
6.6.2 Potential Impacts.......................................................................6-34<br />
6.6.3 Permitting/Approval Requirements...........................................6-34<br />
6.6.4 <strong>Flood</strong>pro<strong>of</strong>ing Applicability/Benefit-Cost Analysis..................6-35<br />
6.6.5 <strong>Flood</strong>pro<strong>of</strong>ing Applicability for Repetitive Loss Properties......6-45<br />
SECTION SEVEN: RECOMMENDATIONS................................................................................................. 7-1<br />
7.1 Overview <strong>of</strong> Recommendations..............................................................7-1<br />
7.2 King Street..............................................................................................7-2<br />
7.3 <strong>Waterfront</strong> Commercial ..........................................................................7-8<br />
7.4 North Union............................................................................................7-9<br />
7.5 Jones Point..............................................................................................7-9<br />
7.6 <strong>Flood</strong>wall................................................................................................7-9<br />
7.7 Repetitive Loss Properties ....................................................................7-12<br />
7.8 Nonstructural <strong>Flood</strong> <strong>Mitigation</strong> Measures ............................................7-13<br />
7.9 Additional Recommendations...............................................................7-14<br />
7.10 Potential Federal Funding Options........................................................7-15<br />
7.11 Conclusions ..........................................................................................7-15<br />
SECTION EIGHT: REFERENCES ............................................................................................................... 8-1<br />
28-JUL-10\\ ii
TABLE OF CONTENTS<br />
TABLES<br />
Table 2-1: Return Periods <strong>of</strong> Studied <strong>Flood</strong> Events ...................................................................2-1<br />
Table 2-2: Summary <strong>of</strong> All <strong>Flood</strong> <strong>Mitigation</strong> Alternatives Considered......................................2-4<br />
Table 2-3: <strong>Flood</strong> <strong>Mitigation</strong> Measure Final Rankings................................................................2-7<br />
Table 3-1: Structures Recommended for Elevation <strong>of</strong> Contents...............................................3-13<br />
Table 4-1: Repetitive Loss Properties within <strong>Study</strong> Area...........................................................4-8<br />
Table 5-1: Estimated Loss <strong>of</strong> Business Time .............................................................................5-3<br />
Table 5-2: Expected Annual Probabilities..................................................................................5-4<br />
Table 5-3: Cultural Resource Approval Relative Schedule, Level <strong>of</strong> Effort, and Cost...............5-7<br />
Table 6-1: Comparison <strong>of</strong> Potential <strong>Flood</strong>wall Layout Options.................................................6-2<br />
Table 6-2: <strong>Flood</strong>wall Discharges and Volumes..........................................................................6-5<br />
Table 6-3: <strong>Flood</strong>wall Benefit-Cost Ratio .................................................................................6-10<br />
Table 6-4: Elevated Walkway Discharges and Volumes..........................................................6-15<br />
Table 6-5: Elevated Walkway Benefit-Cost Ratio....................................................................6-19<br />
Table 6-6: Berm Benefit-Cost Ratio.........................................................................................6-25<br />
Table 6-7: Acquisition for Jones Point Benefit-Cost Results ...................................................6-32<br />
Table 6-8: Acquisition for King Street Benefit-Cost Results ...................................................6-32<br />
Table 6-9: Acquisition for <strong>Waterfront</strong> Commercial Benefit-Cost Results................................6-33<br />
Table 6-10: Acquisition for North Union Benefit-Cost Results................................................6-33<br />
Table 6-11: Estimated Costs for Various <strong>Flood</strong>pro<strong>of</strong>ing Methods ...........................................6-35<br />
Table 6-12: <strong>Flood</strong>pro<strong>of</strong>ing Options for Jones Point: 17 Residential Structures........................6-36<br />
Table 6-13: Cost Ratio for Jones Point: 17 Residential Structures ...........................................6-36<br />
Table 6-14: <strong>Flood</strong>pro<strong>of</strong>ing Options for King Street: 23 Commercial Structures ......................6-38<br />
Table 6-15: Benefit Cost Ratio for King Street: 23 Commercial Structures.............................6-38<br />
Table 6-16: <strong>Flood</strong>pro<strong>of</strong>ing Options for King Street: 6 Residential Structures..........................6-39<br />
Table 6-17: Benefit Cost Ratio King Street: 6 Residential Structures ......................................6-39<br />
Table 6-18: <strong>Flood</strong>pro<strong>of</strong>ing Options for <strong>Waterfront</strong> Commercial: 22 Commercial Structures ..6-41<br />
Table 6-19: Benefit Cost Ratio for <strong>Waterfront</strong> Commercial: 22 Commercial Structures .........6-43<br />
Table 6-20: Dry <strong>Flood</strong>pro<strong>of</strong>ing Options for North Union: 37 Residential Structures...............6-43<br />
Table 6-21: Benefit Cost Ratio for North Union: 37 Residential Structures.............................6-45<br />
Table 6-22: Summary <strong>of</strong> <strong>Flood</strong>pro<strong>of</strong>ing Applicability for Repetitive Loss Properties .............6-45<br />
Table 7-1: Applicability <strong>of</strong> <strong>Flood</strong> <strong>Mitigation</strong> Measures .............................................................7-1<br />
28-JUL-10\\ iii
TABLE OF CONTENTS<br />
FIGURES<br />
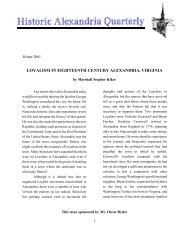
Figure 1-1: Lower King Street Area after Hurricane Isabel, 2003..............................................1-2<br />
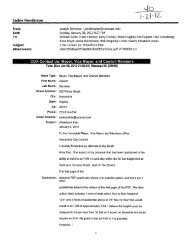
Figure 1-2: Focus Areas.............................................................................................................1-4<br />
Figure 2-1: Inundation Areas for Selected <strong>Flood</strong> Level Categories............................................2-2<br />
Figure 2-2: <strong>Flood</strong> Levels Studied...............................................................................................2-3<br />
Figure 3-1: <strong>Flood</strong>gate.................................................................................................................3-3<br />
Figure 3-2: Three-Foot Dry <strong>Flood</strong>pro<strong>of</strong>ing Limitation...............................................................3-4<br />
Figure 3-3: <strong>Flood</strong>ed Building.....................................................................................................3-4<br />
Figure 3-4: LAG Elevated to Protect Building from <strong>Flood</strong>ing ...................................................3-5<br />
Figure 3-5: <strong>Flood</strong>pro<strong>of</strong> Door......................................................................................................3-6<br />
Figure 4-1: Calculated <strong>Flood</strong> Zone Compared to FEMA <strong>Flood</strong> Zones.......................................4-2<br />
Figure 4-2: Structures Predicted to be <strong>Flood</strong>ed for Each <strong>Flood</strong> Event........................................4-4<br />
Figure 6-1: Proposed <strong>Flood</strong>wall Layout.....................................................................................6-4<br />
Figure 6-2: Interior Drainage Area <strong>of</strong> Proposed <strong>Flood</strong>wall ........................................................6-6<br />
Figure 6-3: Proposed Elevated Walkway Cross-Section ..........................................................6-11<br />
Figure 6-4: Proposed Elevated Walkway Layout .....................................................................6-13<br />
Figure 6-5: Interior Drainage Area <strong>of</strong> Proposed Elevated Walkway ........................................6-14<br />
Figure 6-6: Proposed Jones Point Berm Layout .......................................................................6-20<br />
Figure 6-7: Interior Drainage Area for Jones Point Berm Drainage Area.................................6-22<br />
Figure 6-8: Area <strong>of</strong> Proposed Regrading..................................................................................6-27<br />
Figure 6-9: Jones Point Focus Area <strong>Flood</strong>pro<strong>of</strong>ing Options.....................................................6-37<br />
Figure 6-10: King Street Focus Area <strong>Flood</strong>pro<strong>of</strong>ing Options...................................................6-40<br />
Figure 6-11: <strong>Waterfront</strong> Focus Area <strong>Flood</strong>pro<strong>of</strong>ing Options ...................................................6-42<br />
Figure 6-12: North Union Focus Area <strong>Flood</strong>pro<strong>of</strong>ing Options.................................................6-44<br />
Figure 7-1: Elevated Walkway at <strong>Waterfront</strong> Park (View 1)......................................................7-3<br />
Figure 7-2: Elevated Walkway at <strong>Waterfront</strong> Park (View 2)......................................................7-4<br />
Figure 7-3: Elevated Walkway at Park South <strong>of</strong> Parking Lot on Strand Street...........................7-5<br />
Figure 7-4: 10-year <strong>Flood</strong> Inundation Before and After Elevated Pedestrian Walkway.............7-6<br />
Figure 7-5: Structures Protected by Elevated Walkway .............................................................7-7<br />
Figure 7-6: <strong>Flood</strong>wall behind Torpedo Factory........................................................................7-10<br />
Figure 7-7: <strong>Flood</strong>wall in Front <strong>of</strong> Chart House........................................................................7-11<br />
28-JUL-10\\ iv
Appendices<br />
Appendix A Initial Ranking <strong>of</strong> Potential <strong>Flood</strong> <strong>Mitigation</strong> Solutions<br />
Appendix B Ordinance and Sandbag Information<br />
Exhibit 1 - Sample Ordinances from Other Communities<br />
Appendix C Non-Prioritized Measures<br />
Appendix D Data Collection<br />
Exhibit 1 – Survey data<br />
Exhibit 2 – Field Visit Summary - July 23, 2009<br />
Exhibit 3 – Rainfall Data<br />
Appendix E Economic Valuation Results<br />
Appendix F <strong>Flood</strong>wall<br />
Exhibits 1-1 to 1-5 – Alternative <strong>Flood</strong>wall Layouts<br />
Exhibits 2-1 and 2-2 – <strong>Flood</strong>wall Cross Sections<br />
Exhibit 3 – Various Tables<br />
Exhibit 4 – TR-55 Worksheets<br />
Appendix G Elevated Walkway<br />
Appendix H Berm<br />
Exhibit 1 – VDOT Cross Section<br />
Exhibit 2 – Elevated Walkway Cross Section<br />
Exhibit 3 – Various Tables<br />
Exhibit 4 – TR-55 Worksheets<br />
Appendix I Roadway Drainage<br />
Appendix J Property Acquisition<br />
Appendix K <strong>Flood</strong>pro<strong>of</strong>ing<br />
Exhibit 1 – Additional Costs for Acquisition<br />
Exhibit 2 – Total Other Costs for Property Acquisition<br />
Exhibit 3 – Method for Computing the Fair Market Value<br />
Exhibit 1 – <strong>Flood</strong>pro<strong>of</strong>ing Cost Estimates<br />
Exhibit 2 – Window Replacement Costs<br />
Exhibit 3 – FEMA Guidance on <strong>Flood</strong>pro<strong>of</strong>ing Utility Systems<br />
Appendix L Potential Federal Funding Options<br />
TABLE OF CONTENTS<br />
28-JUL-10\\ v
ac acre<br />
A/E Architectural/Engineering<br />
ADA American with Disabilities Act<br />
ASCE American Society <strong>of</strong> Civil Engineers<br />
Acronyms and Abbreviations<br />
ASCE 24 ASCE Standard 24, "<strong>Flood</strong> Resistant Design and Construction"<br />
BAR Board <strong>of</strong> Architectural Review<br />
BCA Benefit Cost Analysis<br />
BCR Benefit Cost Ratio<br />
BFE Base <strong>Flood</strong> Elevation<br />
BRV Building Replacement Value<br />
C Centigrade<br />
CFM Certified <strong>Flood</strong>plain Manager<br />
CFR Code <strong>of</strong> Federal Regulations<br />
cfs cubic feet per second<br />
COA Certificate <strong>of</strong> Appropriateness<br />
CRS Community Rating System<br />
D.C. District <strong>of</strong> Columbia<br />
DCR [Virginia] Department <strong>of</strong> Conservation and Recreation<br />
DPZ Department <strong>of</strong> Planning and Zoning<br />
EAB Expected Annual Benefit<br />
EAP Expected Annual Probability<br />
FEMA Federal Emergency Management Agency<br />
FFE Finished Floor Elevation<br />
FIRM <strong>Flood</strong> Insurance Rate Map<br />
FIS <strong>Flood</strong> Insurance <strong>Study</strong><br />
FMA <strong>Flood</strong> <strong>Mitigation</strong> Assistance<br />
FMV Fair Market Value<br />
GIS Geographic Information System<br />
28-JUL-10\\ vi
GPS Global Positioning System<br />
HAZUS Hazards United States<br />
HMGP Hazard <strong>Mitigation</strong> Grant Program<br />
I&I Inflow and Infiltration<br />
IBC International Building Code<br />
IP Individual Permit<br />
IPCC Intergovernmental Panel on Climate Change<br />
JPA Joint Permit Application (USACE)<br />
LAG Lowest Adjacent Grade<br />
LSI Lower Substantial Improvement Threshold<br />
MD Maryland<br />
MHW Mean High Water<br />
NAVD88 North American Vertical Datum <strong>of</strong> 1988<br />
NC North Carolina<br />
NEPA National Environmental Policy Act<br />
NFIP National <strong>Flood</strong> Insurance Program<br />
NGS National Geodetic Survey<br />
NGVD29 National Geodetic Vertical Datum <strong>of</strong> 1929<br />
NHPA National Historic Preservation Act<br />
NPS National Park Service<br />
NPV Net Present Value<br />
NRHP National Register <strong>of</strong> Historic Places<br />
PDM Pre-Disaster <strong>Mitigation</strong><br />
PID HV9658 Permanent Identifier for Benchmark Disk HV9658<br />
RFC Repetitive <strong>Flood</strong> Claims<br />
RPA Resource Protection Area<br />
SFHA Special <strong>Flood</strong> Hazard Area<br />
SPGP State Program General Permit<br />
SRL Severe Repetitive Loss<br />
Acronyms and Abbreviations<br />
28-JUL-10\\ vii
TES Transportation and Environmental Services<br />
Acronyms and Abbreviations<br />
TPS Total Station (Leica high performance total station series instrument)<br />
USACE United States Army Corps <strong>of</strong> Engineers<br />
USBC Uniform Statewide Building Code<br />
USGS U.S. Geological Survey<br />
VA Virginia<br />
VCS83 Virginia Coordinate System <strong>of</strong> 1983<br />
VDEQ Virginia Department <strong>of</strong> Environmental Quality<br />
VDHR Virginia Department <strong>of</strong> Historic Resources<br />
VDHR DSS Virginia Department <strong>of</strong> Historic Resources Data Sharing System<br />
VMRC Virginia Marine Resources Commission<br />
VSMP Virginia Stormwater Management Program<br />
28-JUL-10\\ viii
Executive Summary<br />
The <strong>City</strong> <strong>of</strong> <strong>Alexandria</strong> frequently experiences flooding from the <strong>Potomac</strong> River. The flooding<br />
affects residences, businesses, and infrastructure along the <strong>City</strong>’s waterfront. In 2006 the <strong>City</strong><br />
commissioned the <strong>Potomac</strong> River <strong>Waterfront</strong> <strong>Flood</strong> <strong>Mitigation</strong> <strong>Study</strong> to identify and assess<br />
flooding problems and recommend solutions to reduce flood damages. In October 2007 an Initial<br />
<strong>Flood</strong>ing Assessment Report was completed that identified specific flooding problems and their<br />
causes, and identified and categorized potential flood mitigation solutions. This report evaluates<br />
and recommends the most effective solutions.<br />
Twenty-seven mitigation measures were identified and discussed in a series <strong>of</strong> meetings with the<br />
<strong>City</strong> and the public. The following mitigation measures were selected for detailed evaluation.<br />
Structural measures: provide dry floodpro<strong>of</strong>ing; acquire properties; elevate structures;<br />
construct engineered structural barriers (i.e., waterfront floodwall and Jones Point Berm)<br />
construct an elevated walkway that would also be a floodwall structure; and increase the inlet<br />
and road elevation in the vicinity <strong>of</strong> the Lower King Street area.<br />
Nonstructural measures: relocate internal supplies, products/goods above the flooding<br />
depth; improve the <strong>City</strong>’s floodplain and zoning ordinances; and improve the sandbag<br />
programs or provide other temporary flood deterrents<br />
Rather than a single flood mitigation solution, a series <strong>of</strong> measures is recommended to provide<br />
protection against flood events on the <strong>Potomac</strong> River. Three structural measures are<br />
recommended: the elevated walkway, floodpro<strong>of</strong>ing, and the inlet and roadway improvements.<br />
The elevated walkway would provide flood protection for up to and including the 10-year flood<br />
event. It is a cost effective way to minimize the smaller flood events that frequently damage<br />
properties adjacent to the river. The low pr<strong>of</strong>ile also minimizes the impact on the scenic views<br />
from the waterfront area.<br />
Dry floodpro<strong>of</strong>ing consists <strong>of</strong> a variety <strong>of</strong> methods to protect structures from flood waters during<br />
small storm events. These methods generally consist <strong>of</strong> removable barriers that could be installed<br />
in front <strong>of</strong> doors and windows to prevent flood waters from inundating the first floors <strong>of</strong><br />
structures.<br />
King Street intersections with Strand Street and North Union Street are low points that frequently<br />
require road closures due to flooding. Raising the roadway pr<strong>of</strong>iles near these intersections will<br />
allow stormdrain catch basins and manholes to be elevated and reduce the frequency <strong>of</strong> road<br />
closures.<br />
These structural measures require significant capital expense and cooperation from private<br />
property owners. In addition, these projects call for significant effort to comply with applicable<br />
regulations.<br />
To further safeguard all properties, numerous nonstructural recommendations are made, which<br />
include improvement <strong>of</strong> the <strong>City</strong>’s floodplain ordinances and the existing sandbag program.<br />
Proceeding with implementation <strong>of</strong> the recommended flood mitigation measures is essential to<br />
reduce the frequent and extensive flood damage in the <strong>City</strong>.<br />
28-JUL-10\\ ES-1
SECTION ONE: INTRODUCTION<br />
1.1 POTOMAC RIVER FLOOD MITIGATION STUDY OVERVIEW<br />
Introduction<br />
The <strong>Potomac</strong> River is a major flooding source within the <strong>City</strong> <strong>of</strong> <strong>Alexandria</strong>. <strong>Flood</strong>ing from the<br />
<strong>Potomac</strong> River is a recurring threat that has significantly impacted residential homes, businesses,<br />
and infrastructure along the <strong>City</strong> <strong>of</strong> <strong>Alexandria</strong>’s waterfront. In response to the flooding issues,<br />
the <strong>City</strong> <strong>of</strong> <strong>Alexandria</strong> commissioned the <strong>Potomac</strong> River <strong>Waterfront</strong> <strong>Flood</strong> <strong>Mitigation</strong> <strong>Study</strong> in<br />
2006 to identify and assess flooding problems and to develop, evaluate, and recommend<br />
solutions to reduce the threat <strong>of</strong> flood damages in the <strong>City</strong> along the <strong>Potomac</strong> River.<br />
The <strong>Potomac</strong> River <strong>Flood</strong> <strong>Mitigation</strong> <strong>Study</strong> applied a typical problem-solving process:<br />
1. Identify the specific flooding problems<br />
2. Determine the specific cause <strong>of</strong> the problems<br />
3. Identify solutions<br />
4. Evaluate solutions<br />
5. Recommend the most effective solutions<br />
The Initial <strong>Flood</strong>ing Assessment Report, prepared by URS Corporation and dated October 2007,<br />
addressed the first three steps: identify the flooding problems, determine the causes, and identify<br />
potential solutions. This report concentrates on the last two steps: evaluating solutions and<br />
recommending the most effective solutions. This report summarizes the detailed engineering<br />
assessments conducted as part <strong>of</strong> the feasibility evaluation <strong>of</strong> potential measures and<br />
recommends cost-effective solutions that consider historic/archaeological resources,<br />
business/tourism impacts, and environmental impacts.<br />
1.2 BACKGROUND<br />
The <strong>City</strong> <strong>of</strong> <strong>Alexandria</strong>’s waterfront lies within the <strong>Potomac</strong> River watershed and frequently<br />
experiences flooding. <strong>Flood</strong>ing severely disrupts businesses in the area and causes extensive<br />
damage to property. The <strong>City</strong> estimates that $32,000 is expended per flooding event for<br />
maintenance and public safety personnel and for material costs for sandbags and equipment. This<br />
cost does not include lost business revenue and water damage to businesses or residential<br />
properties. <strong>Flood</strong>ing along the waterfront has resulted from heavy rains, snow melt, storm surges,<br />
strong winds, tropical storms, and hurricanes.<br />
Major floods within the <strong>City</strong> <strong>of</strong> <strong>Alexandria</strong> in recent history were recorded in 1972, 1983, 1996,<br />
and 2003. Two floods in 1996 significantly impacted <strong>Alexandria</strong>’s waterfront. The January 1996<br />
flood was due to a heavy snowfall followed by a period <strong>of</strong> rain and warm temperatures. In<br />
September 1996, Hurricane Fran caused flooding along the <strong>Potomac</strong> River and evacuations <strong>of</strong><br />
properties in Old Town <strong>Alexandria</strong>. In February 2003, record levels <strong>of</strong> snow followed by rain<br />
also caused flooding in <strong>Alexandria</strong>.<br />
The most significant recent flood event was due to tidal flooding occurring during Hurricane<br />
Isabel. Hurricane Isabel, which occurred in September 2003, made landfall on the North Carolina<br />
coast. Isabel weakened to a tropical storm in Virginia, but the storm’s 40- to 60-mile-per-hour<br />
28-JUL-10\\ 1-1
Introduction<br />
sustained winds pushed a bulge <strong>of</strong> water up the Chesapeake Bay and the <strong>Potomac</strong> River. In<br />
<strong>Alexandria</strong>, the water level in Old Town reached 8.8 feet North American Vertical Datum <strong>of</strong><br />
1988 (NAVD88). Figure 1-1 is a representative photograph taken in the Lower King Street area<br />
soon after Hurricane Isabel passed through. Businesses and residential losses were extensive.<br />
1.3 STUDY AREA<br />
Figure 1-1: Lower King Street Area after Hurricane Isabel, 2003<br />
The study area for this project is defined as the area affected by flooding associated with the<br />
<strong>Potomac</strong> River. In general, the southern boundary is the Capital Beltway and the northern<br />
boundary is near the railroad tracks near Bashford Lane. For the purposes <strong>of</strong> this report, the study<br />
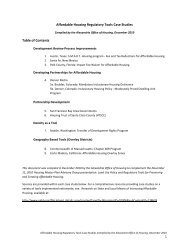
area was divided into four focus areas, which are shown in Figure 1-2:<br />
Jones Point: This focus area is named for the Jones Point Park that abuts the residential<br />
neighborhood. The houses are built <strong>of</strong> brick and many have basements. All <strong>of</strong> the houses in the<br />
flood prone areas are multi-family residential homes (e.g., townhouses) with the exception <strong>of</strong><br />
210 Lee Court and 211 Lee Court, which are single-family structures. The structures are all<br />
located in the National Register District. Approximately 17 <strong>of</strong> the structures in the Jones Point<br />
focus area are predicted to experience flooding for the 100-year event.<br />
King Street: This focus area is a mixed-use area (commercial and residential) near the Lower<br />
King Street. The boundary begins at the north at Fayette Alley, runs south down South Union<br />
Street, cuts through the neighborhood between Prince and Duke Streets and continues up to<br />
South Lee Street. Approximately 23 commercial and six residential structures in the King Street<br />
focus area are predicted to experience flooding for the 100-year event.<br />
<strong>Waterfront</strong> Commercial: The <strong>Waterfront</strong> Commercial focus area includes commercial<br />
structures fronting the <strong>Potomac</strong> River on the eastern boundary <strong>of</strong> the focus area. The Torpedo<br />
28-JUL-10\\ 1-2
Introduction<br />
Factory and Strand Street are included in this focus area. South Union Street and North Union<br />
Street bound the focus area on the west. It extends to the north where Pendleton Street runs into<br />
North Union Street and ends in the south at Wolfe Street. Approximately 22 structures in the<br />
<strong>Waterfront</strong> study area are predicted to flood during the 100-year event.<br />
North Union: This focus area is entirely residential row houses. The focus area is bounded by<br />
Oronoco and Cameron Streets and is located just west <strong>of</strong> the <strong>Waterfront</strong> Commercial focus area.<br />
Approximately 37 structures within the North Union Street <strong>Study</strong> Area are predicted to flood<br />
during the 100-year event.<br />
1.4 REPORT ORGANIZATION<br />
The purpose <strong>of</strong> this report is to evaluate the solutions identified in the Initial <strong>Flood</strong>ing<br />
Assessment Report and recommend the most effective solutions. The remainder <strong>of</strong> this report is<br />
organized as follows:<br />
Section 2 summarizes the process that was followed to select mitigation options to be<br />
evaluated in detail.<br />
Section 3 describes the mitigation measures identified in Section 2 and the general feasibility<br />
<strong>of</strong> the mitigation measure as a solution to the problems identified in these focus areas.<br />
Section 4 summarizes the existing data review; the context for the cultural and natural<br />
resources analyses; repetitive loss structures within the study area; and the consideration <strong>of</strong><br />
sea level rise for this study.<br />
Section 5 describes the methodology used to define and analyze the costs and benefits <strong>of</strong><br />
mitigation solutions that involve structural design or alteration.<br />
Section 6 summarizes the conceptual design analyses and results for the structural mitigation<br />
measures.<br />
Section 7 provides overall study recommendations.<br />
28-JUL-10\\ 1-3
N ALFRED ST<br />
MUIRS CT<br />
S COLUMBUS ST<br />
CLIENT<br />
PROJ<br />
REVISION NO<br />
SCALE<br />
N COLUMBUS ST<br />
S WASHINGTON ST<br />
WOLFE ST<br />
WILKES ST<br />
S SAINT ASAPH ST<br />
PRINCESS ST<br />
GIBBON ST<br />
<strong>City</strong> <strong>of</strong> <strong>Alexandria</strong><br />
N WASHINGTON ST<br />
S SAINT ASAPH ST<br />
S PITT ST<br />
ROSS AL<br />
ORONOCO ST<br />
PRINCE ST<br />
S PITT ST<br />
GREEN ST<br />
N SAINT ASAPH ST<br />
JEFFERSON CT<br />
QUEEN ST<br />
DUKE ST<br />
S ROYAL ST<br />
FRANKLIN ST<br />
JEFFERSON ST<br />
N PITT ST<br />
<strong>Potomac</strong> River <strong>Waterfront</strong> <strong>Flood</strong> <strong>Mitigation</strong> <strong>Study</strong><br />
1 inch = 400 feet<br />
W:\<strong>City</strong> <strong>of</strong> <strong>Alexandria</strong>\15298470 - Lower King St\Task 3\Report<br />
\Final\Figures\MXDs\F1-2 Focus_Areas.mxd<br />
0 DES BY<br />
DR BY<br />
CHK BY<br />
CJL<br />
CJL<br />
MER<br />
09/11/09<br />
09/24/09<br />
10/04/09<br />
S FAIRFAX ST<br />
LEE CT<br />
N ROYAL ST<br />
North Union<br />
King Street<br />
Jones Point<br />
S LEE ST<br />
N FAIRFAX ST<br />
CAMERON ST<br />
RAMSAY AL<br />
KING ST<br />
SWIFTS AL<br />
POTOMAC ST<br />
0 100 200 400<br />
Feet<br />
TANCIL CT<br />
POTOMAC CT<br />
TITLE<br />
S UNION ST<br />
N LEE ST<br />
WALES AL<br />
BATTERY PL<br />
TOBACCO QY<br />
QUAY ST<br />
FAYETTE AL<br />
S UNION ST<br />
WILKES ST<br />
KEITH'S LA<br />
FRANKLIN ST<br />
N UNION ST<br />
STRAND ST<br />
WHARF ST<br />
ALEXANDER ST<br />
Focus Areas<br />
THOMPSONS AL<br />
CAMERON ST<br />
STRAND ST<br />
200 Orchard Ridge Drive<br />
Gaithersburg, MD 20878<br />
<strong>Waterfront</strong> Commercial<br />
<strong>Potomac</strong> River<br />
Legend<br />
Jones Point<br />
King Street<br />
North Union<br />
<strong>Waterfront</strong> Commercial<br />
Buildings<br />
PROJ NO<br />
FIGURE<br />
1-2<br />
15298592
Refinement <strong>of</strong> <strong>Mitigation</strong> Measures<br />
SECTION TWO: REFINEMENT OF MITIGATION MEASURES<br />
2.1 SUMMARY OF INITIAL FLOODING ASSESSMENT<br />
As part <strong>of</strong> this project, URS prepared the Initial <strong>Flood</strong>ing Assessment Report, dated October<br />
2007, which summarized flooding problems, identified their causes, and identified and<br />
categorized potential flood mitigation solutions. In addition, this report identified three types <strong>of</strong><br />
flooding events to be considered.<br />
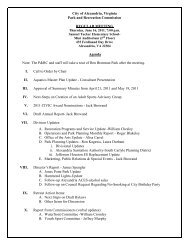
The project considers three discrete flood events: nuisance flooding (elevation 4.0 feet North<br />
American Vertical Datum [NAVD]); intermediate flooding (elevation 8.0 feet NAVD); and<br />
extreme flooding (elevation 10.2 feet NAVD). The three flood events have return periods<br />
associated with them. A return period or recurrence interval is the estimated period <strong>of</strong> time<br />
between occurrences <strong>of</strong> equal-sized events. For example, the Federal Emergency Management<br />
Agency (FEMA) Base <strong>Flood</strong> has a return period <strong>of</strong> 100 years; therefore, it is referred to as the<br />
100-year flood or one percent annual flood. Figure 2-1 shows the inundation areas for selected<br />
flood-level categories.<br />
For the extreme and intermediate floods, the return period was interpolated from the <strong>City</strong> <strong>of</strong><br />
<strong>Alexandria</strong> and District <strong>of</strong> Columbia <strong>Flood</strong> Insurance Studies (FISs), specifically the <strong>Potomac</strong><br />
River flood pr<strong>of</strong>ile. The 6-foot flood elevation event was analyzed for a specific flood mitigation<br />
alternative that is discussed later in this report. A logarithmic equation was developed using all<br />
four flood elevations and known return intervals. For the nuisance flood, the return period was<br />
computed through a statistical regression analysis <strong>of</strong> a U.S. Geological Survey (USGS) tidal<br />
stream gage located on the <strong>Potomac</strong> River at Wisconsin Avenue in Washington, D.C. The return<br />
periods for the flood events are listed in Table 2-1.<br />
Table 2-1: Return Periods <strong>of</strong> Studied <strong>Flood</strong> Events<br />
<strong>Flood</strong> Event Elevation (feet NAVD) Return Period (years)<br />
Nuisance 4.0 1.5<br />
6-foot <strong>Flood</strong> (Elevated Walkway) 6.0 10<br />
Intermediate 8.0 30<br />
Extreme 10.2 100<br />
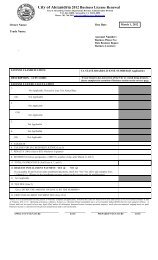
Figure 2-1 shows the areas <strong>of</strong> inundation for the 4-foot, 8-foot and 10.2 foot flood elevations.<br />
Figure 2-2 provides a graphical representation <strong>of</strong> Table 2-1, with additional reference points<br />
including the peak elevation <strong>of</strong> flooding during Hurricane Isabel, mean high and low water<br />
elevations and the relative height for a floodwall that would protect against the 100-year flood<br />
level with three feet <strong>of</strong> freeboard.<br />
28-JUL-10\\ 2-1
CLIENT<br />
PROJ<br />
REVISION NO<br />
SCALE<br />
<strong>City</strong> <strong>of</strong> <strong>Alexandria</strong><br />
<strong>Potomac</strong> Waterfron <strong>Flood</strong> <strong>Mitigation</strong> <strong>Study</strong><br />
0<br />
1:12000<br />
W:\<strong>City</strong> <strong>of</strong> <strong>Alexandria</strong>\15298470 - Lower King St\Task 3<br />
\Report\Final\Figures\MXDs\F2-1 <strong>Flood</strong> Inundation.mxd<br />
DES BY<br />
DR BY<br />
CHK BY<br />
KJM<br />
CJL<br />
MER<br />
06/22/07<br />
10/05/09<br />
10/04/09<br />
0 250 500<br />
Feet<br />
10.2 ft - Extreme <strong>Flood</strong><br />
P o t o m a c R i v e r<br />
8.0 ft - Intermediate <strong>Flood</strong><br />
4.0 ft - Nuisance <strong>Flood</strong><br />
Legend<br />
TITLE Inundation Areas for Selected <strong>Flood</strong> Level Categories<br />
200 Orchard Ridge Drive<br />
Gaithersburg, MD 20878<br />
<strong>Study</strong> Area Limits<br />
Railroad<br />
Buildings<br />
<strong>Flood</strong> Elevation (ft)<br />
4.0 Nuisance <strong>Flood</strong><br />
8.0 Intermediate <strong>Flood</strong><br />
10.2 Extreme <strong>Flood</strong><br />
Datum: NAVD88<br />
PROJ NO<br />
15298592<br />
FIGURE<br />
2-1
8.8 ft<br />
Figure 2-2: <strong>Flood</strong> Levels Studied<br />
Refinement <strong>of</strong> <strong>Mitigation</strong> Measures<br />
13.2 ft Extreme with 3 feet freeboard<br />
10.2 ft<br />
8.0 ft<br />
4.0 ft<br />
2.2<br />
ft<br />
-0.9 ft<br />
Extreme (100-year flood level)<br />
Hurricane Isabel<br />
Intermediate<br />
Nuisance<br />
Mean High Water<br />
Mean Low Water<br />
* NAVD 88<br />
28-JUL-10\\ 2-3
2.2 LIST OF COMPREHENSIVE FLOOD MITIGATION MEASURES<br />
Refinement <strong>of</strong> <strong>Mitigation</strong> Measures<br />
A comprehensive list <strong>of</strong> potential flood mitigation measures was developed. This list, which<br />
includes 27 potential flood mitigation measures, was developed through a comprehensive<br />
brainstorming process in conjunction with the <strong>City</strong> and from input provided in public meetings<br />
that occurred from October 2007 through November 2008. The potential flood mitigation<br />
measures were classified by type <strong>of</strong> mitigation into the following categories:<br />
Property Protection<br />
Structural Projects<br />
<strong>Flood</strong> Prevention<br />
Emergency Services<br />
Public Education and Awareness<br />
A “do-nothing” option was also defined; however, this was used as the baseline alternative and<br />
only analyzed during this preliminary solution analysis. Within each type <strong>of</strong> measure, each<br />
alternative was given a general solution title. For example, solutions under property protection<br />
that involve preventing damage to contents within a structure are classified as floodpro<strong>of</strong>ing<br />
solutions. The comprehensive list <strong>of</strong> potential flood mitigation measures is provided in Table<br />
2-2.<br />
Table 2-2: Summary <strong>of</strong> All <strong>Flood</strong> <strong>Mitigation</strong> Alternatives Considered<br />
Type <strong>of</strong> Measure Solution Description<br />
PP1. Provide wet floodpro<strong>of</strong>ing to make<br />
uninhabited portions <strong>of</strong> structures resistant to<br />
flood damage.<br />
PP2. Provide dry floodpro<strong>of</strong>ing with<br />
impermeable membranes and watertight<br />
<strong>Flood</strong>pro<strong>of</strong>ing<br />
shields to prevent floodwaters from entering<br />
Property Protection<br />
buildings.<br />
PP3. Relocate internal supplies,<br />
products/goods, and utilities above the flooding<br />
depth.<br />
PP4. Relocate external electrical boxes.<br />
Acquisition<br />
PP5. Acquire properties experiencing frequent<br />
flooding.<br />
Elevation <strong>of</strong> structure PP6. Elevate structures.<br />
Structural Projects<br />
<strong>Flood</strong>wall<br />
Raised boardwalk acting as<br />
floodwall<br />
Stormdrain improvements<br />
S1. Build an engineered structure to act as a<br />
barrier between the <strong>Potomac</strong> River and<br />
<strong>Alexandria</strong><br />
S2. Build a pedestrian boardwalk that would<br />
also be a floodwall structure.<br />
S3. Increase the inlet and road elevation to<br />
prevent overflow from nuisance flooding<br />
events.<br />
S4. Increase the storm drain pipe size.<br />
S5. Eliminate Inflow and Infiltration (I&I).<br />
28-JUL-10\\ 2-4
Refinement <strong>of</strong> <strong>Mitigation</strong> Measures<br />
Type <strong>of</strong> Measure Solution Description<br />
S6. Improve flapgate operation at outflow<br />
points.<br />
S7. Add sump pumps.<br />
Underground storage S8. Create areas for underground storage.<br />
Detention structures S9. Provide detention/retention structures.<br />
Construct an <strong>of</strong>fshore groin S10. Construct an <strong>of</strong>fshore groin.<br />
Prevention<br />
Emergency Services<br />
Public Education and<br />
Awareness<br />
Sewer backflow preventers<br />
Enhancement <strong>of</strong><br />
floodplain ordinances<br />
Minimizing electrical and<br />
gas outages after a flood<br />
ID system<br />
<strong>Flood</strong> warning system<br />
PR1. Add backflow preventers in homes to<br />
prevent stormwater (and sewer) backups.<br />
PR2. Improve the <strong>City</strong>’s floodplain and zoning<br />
ordinances.<br />
ES1. Isolate service so that only the buildings<br />
affected by flooding would have service turned<br />
<strong>of</strong>f.<br />
ES2. Improve/enhance existing business<br />
identification system for returning to impacted<br />
area.<br />
ES3. Implement system to provide text<br />
messages, announcements, and/or phone<br />
messages regarding the status <strong>of</strong> the flooding.<br />
Emergency response ES4. Improve the <strong>City</strong>’s emergency response.<br />
Temporary structures<br />
ES5. Provide sandbags or other flood<br />
deterrents for residents and businesses.<br />
Cleanup program ES6. Provide improved cleanup program.<br />
Media involvement and<br />
outreach<br />
Transportation plans<br />
Insurance outreach<br />
2.3 REFINEMENT OF MITIGATION OPTIONS<br />
EA1. Provide education to area media outlets<br />
about what is causing the flooding, how to<br />
avoid flooded areas, and what in <strong>Alexandria</strong><br />
would remain open and accessible.<br />
EA2. Create maps, provide signs, and help<br />
erect barriers (that would be only as large as<br />
needed) to show visitors and residents how to<br />
navigate the streets and show what<br />
businesses and parking areas remain open.<br />
EA3. Inform business and residents about<br />
reimbursement for damages other than just<br />
exterior building damages.<br />
As part <strong>of</strong> this study, the mitigation alternatives in Table 2-2 were ranked using a numerical<br />
evaluation criteria to select flood mitigation measures for further consideration. The criteria,<br />
along with the respective weighting, are shown in Appendix A. <strong>City</strong> staff reviewed and approved<br />
the scoring matrix criteria. The criteria that were considered in the ranking are listed below, with<br />
the heaviest ranked criteria listed first:<br />
Reduction <strong>of</strong> <strong>Flood</strong>ing Extent<br />
Cost to Property Owners<br />
28-JUL-10\\ 2-5
Loss <strong>of</strong> Business Revenue<br />
Aesthetics<br />
Constructability<br />
<strong>City</strong> Liability<br />
Effect on <strong>Potomac</strong> River Viewshed<br />
Private Property Acquisition<br />
State/Federal Funding<br />
Repetitive Loss Property <strong>Mitigation</strong><br />
Cost <strong>of</strong> <strong>Flood</strong> Insurance<br />
Property Ownership<br />
General Environmental Impacts (wetlands, forested areas)<br />
Loss <strong>of</strong> Recreational Use<br />
Historic/Archaeological Resources<br />
Regulatory Requirements<br />
Refinement <strong>of</strong> <strong>Mitigation</strong> Measures<br />
Each criterion was given a weighting factor, based on the goals <strong>of</strong> the overall flood mitigation<br />
study. A heavier weight was given to options that would prevent more frequent floods. Measures<br />
that protect against frequent floods typically provide the greatest cost benefit, because those<br />
floods occur more <strong>of</strong>ten and result in extensive damages. Second, mitigation measures that<br />
provide protection to a large number <strong>of</strong> structures were also heavily weighted. Since the <strong>City</strong>’s<br />
budget is a concern, capital costs were also weighted heavily as directed by <strong>City</strong> staff. Therefore,<br />
project capital cost, the criteria that directly relate to reducing nuisance flooding and the number<br />
<strong>of</strong> structures protected were given the highest weights, a value <strong>of</strong> 10.<br />
The next level were those criteria that related to extreme or intermediate flood protection,<br />
aesthetics, reducing damages, reducing actual flooding extents, loss <strong>of</strong> business revenue and<br />
impacts to the <strong>Potomac</strong> River viewshed (loss <strong>of</strong> views along waterfront). These were ranked<br />
slightly lower, a weight value <strong>of</strong> 5, as they are important criteria, but were not considered drivers<br />
in this screening process.<br />
A slightly lower weight value <strong>of</strong> 3 was given to constructability, city liability, maintenance costs,<br />
private property acquisition, state and/or federal funding availability, and protection <strong>of</strong> repetitive<br />
loss structures (discussed in Section 4.1.5). Lastly, impacts to flood insurance costs, property<br />
ownership, environmental impacts, loss <strong>of</strong> recreational use, and regulatory requirements were<br />
weighted the lowest, at a value <strong>of</strong> 1.<br />
Each flood mitigation alternative was then given a score for each criterion and the total weighted<br />
rankings were summed to provide an overall score. The ranking system was developed so that<br />
positive impacts were given a score <strong>of</strong> 10 and negative or no impacts within that criterion were<br />
given a score <strong>of</strong> 1.<br />
In conjunction with the <strong>City</strong>, a series <strong>of</strong> sensitivity analyses were performed with slight<br />
variations in the weight factors for certain criteria and for each alternative’s ranking within a<br />
28-JUL-10\\ 2-6
Refinement <strong>of</strong> <strong>Mitigation</strong> Measures<br />
specific criterion. This was to verify that the final alternatives that would be analyzed in further<br />
detail were not being subjectively selected by the process. The final score and overall rank for<br />
each flood mitigation alternative are listed in Table 2-3.<br />
Alternative<br />
ID<br />
Total<br />
Score<br />
Table 2-3: <strong>Flood</strong> <strong>Mitigation</strong> Measure Final Rankings<br />
Ranking Alternative Definition<br />
S1 500 1 Build an engineered structure to act as a barrier between the<br />
<strong>Potomac</strong> River and <strong>Alexandria</strong>.<br />
S2 499 2 Build a pedestrian boardwalk that would also be a floodwall<br />
structure.<br />
PP5 473 3 Acquire properties experiencing frequent flooding.<br />
ES5 466 4 Provide sandbags or other flood deterrents for residents and<br />
businesses.<br />
S3 439 5 Increase the inlet and road elevation to prevent overflow from<br />
nuisance flooding events.<br />
PP6 435 6 Elevate structures.<br />
PP2 396 7 Provide dry floodpro<strong>of</strong>ing with impermeable membranes and<br />
watertight shields to prevent floodwaters from entering<br />
buildings.<br />
PR2 389 8 Improve the <strong>City</strong>’s floodplain and zoning ordinances.<br />
PP3 379 9 Relocate internal supplies, products/goods, and utilities above<br />
the flooding depth.<br />
S6 376 10 Improve flapgate operation at outflow points.<br />
PP1 348 11 Provide wet floodpro<strong>of</strong>ing to make uninhabited portions <strong>of</strong><br />
structures resistant to flood damage.<br />
PR1 339 12 Add backflow preventers in homes to prevent stormwater (and<br />
sewer) backups.<br />
ES1 334 13 Isolate service so that only the buildings affected by flooding<br />
would have service turned <strong>of</strong>f.<br />
PP4 324 14 Relocate external electrical boxes.<br />
ES4 323 15 Improve the <strong>City</strong>’s emergency response.<br />
EA3 309 16 Inform business and residents about reimbursement for<br />
damages other than just exterior building damages.<br />
Do Nothing 309 16 Do nothing.<br />
ES2 303 18 Improve/enhance existing business identification system for<br />
returning to impacted area.<br />
ES3 303 18 Implement system to provide text messages, announcements,<br />
and/or phone messages regarding the status <strong>of</strong> the flooding.<br />
ES6 299 20 Provide improved cleanup program.<br />
EA1 294 21 Provide education to area media outlets about what is causing<br />
the flooding, how to avoid flooded areas, and what in<br />
<strong>Alexandria</strong> would remain open and accessible.<br />
EA2 279 22 Create maps, provide signs, and help erect barriers (that would<br />
be only as large as needed) to show visitors and residents how<br />
to navigate the streets and show what businesses and parking<br />
areas remain open.<br />
S7 254 23 Add sump pumps.<br />
28-JUL-10\\ 2-7
Alternative<br />
ID<br />
Total<br />
Score<br />
Refinement <strong>of</strong> <strong>Mitigation</strong> Measures<br />
Ranking Alternative Definition<br />
S4 252 24 Increase the storm drain pipe size.<br />
S5 244 25 Eliminate Inflow and Infiltration (I&I).<br />
S10 242 26 Maintain an <strong>of</strong>fshore groin.<br />
S8 227 27 Create areas for underground storage.<br />
S9 210 28 Provide detention/retention structures.<br />
The top nine highest-scoring flood mitigation measures were selected for further evaluation. The<br />
measures selected are listed below:<br />
Structural Measures<br />
Provide dry floodpro<strong>of</strong>ing by preventing floodwaters from entering the building with<br />
impermeable membranes.<br />
Acquire properties.<br />
Elevate structures.<br />
Build an engineered structure to act as a barrier between the <strong>Potomac</strong> and <strong>Alexandria</strong>.<br />
Build an elevated boardwalk that would also be a floodwall structure.<br />
Increase the inlet and road elevation to prevent overflow from nuisance flooding events.<br />
Nonstructural Measures<br />
Relocate supplies and products above the flooding depth.<br />
Recommend improvements to the <strong>City</strong>’s floodplain and zoning ordinances.<br />
Recommend improvements to the sandbag program or provide other temporary flood<br />
deterrents for residents and businesses.<br />
28-JUL-10\\ 2-8
Overview <strong>of</strong> <strong>Flood</strong> <strong>Mitigation</strong> Measures<br />
SECTION THREE: OVERVIEW OF FLOOD MITIGATION MEASURES<br />
As described in Section 2, ten flood mitigation techniques were selected for further<br />
consideration. They include measures that have structural elements, such as flood barriers, as<br />
well as those that do not require structural changes, such as ordinance revisions and modification<br />
to the <strong>City</strong>’s sandbag program. It should be noted that the ranking analyses were performed<br />
without assessing specific applicability to the <strong>City</strong>. The flood mitigation measures and their<br />
applicability for use within the <strong>City</strong> <strong>of</strong> <strong>Alexandria</strong> are described in this section.<br />
3.1 STRUCTURAL MITIGATION MEASURES<br />
3.1.1 Structural <strong>Flood</strong> Barriers<br />
<strong>Flood</strong> barriers are man-made structures that are built to protect low-lying areas from the<br />
inundation <strong>of</strong> floodwaters. These barriers provide either permanent or temporary flood<br />
protection. Temporary flood barriers are described in Section 3.2.3.<br />
Permanent flood protection is a passive system, meaning it is always in place and requires no<br />
human interaction to activate during flood events. These measures include levees, floodwalls,<br />
and berms. Levees and berms are typically earthen structures that require significant land while<br />
floodwalls take up less space and are typically constructed <strong>of</strong> concrete or steel. Permanent flood<br />
protection is typically an expensive option, which requires ongoing maintenance for continued<br />
flood protection.<br />
Selection <strong>of</strong> the most appropriate flood barrier needs to take into account the frequency, typical<br />
depth, and duration <strong>of</strong> flooding. Next, the level <strong>of</strong> protection desired and the size <strong>of</strong> the area that<br />
needs protection need to be considered. Since the areas being protected by the systems are lowlying,<br />
all flood protection methods need to be extended to (i.e., tied-in to) high ground.<br />
Aesthetics is another important consideration in choosing an appropriate flood barrier. Levees,<br />
floodwalls and berms cause visual impacts and can be viewed as unattractive; they may also<br />
hinder access to waterways. Access to waterways through a flood barrier can be provided by<br />
using a floodgate, which is an opening in the flood barrier that is lowered or closed during flood<br />
events. Consideration <strong>of</strong> all <strong>of</strong> these factors will determine the best type <strong>of</strong> flood barrier for the<br />
project area.<br />
Once the flood barrier is selected, an important design component is interior drainage. During<br />
most rainfall storm events, the discharge from the interior areas can be conveyed by gravity<br />
through the existing stormdrain systems. Stormdrain systems are typically designed to convey<br />
the 10-year discharge.<br />
However, during periods <strong>of</strong> high elevation on the <strong>Potomac</strong> River, high water in the river prevents<br />
gravity flow through the stormdrain system, while flapgates prevent back flow. During this<br />
worst-case scenario (referred to as “coincident peaks”), the flood barrier system would need to<br />
convey the interior drainage for events at least up to the estimated 100-year flood discharge.<br />
Therefore, design concepts include pumping stations to pump the discharge into the <strong>Potomac</strong><br />
River in the event the flapgates are sealed or blocked.<br />
Finally, if the flood protection barrier is to be recognized by FEMA as a flood protection device,<br />
the levee must meet the requirements contained in Section 65.10 <strong>of</strong> the National <strong>Flood</strong> Insurance<br />
28-JUL-10\\ 3-1
Overview <strong>of</strong> <strong>Flood</strong> <strong>Mitigation</strong> Measures<br />
Program (NFIP) regulations. These requirements include at least 3 feet <strong>of</strong> freeboard above the<br />
Base (one-percent annual chance) <strong>Flood</strong> Elevation (BFE), an operation and maintenance plan. If<br />
these criteria are met, the areas on the landward side <strong>of</strong> the levee may be removed from the<br />
floodplain. Only permanent structural flood barriers are permitted to change the floodplain.<br />
Three potential permanent structural flood barrier solutions are evaluated in this report. They are:<br />
100-year <strong>Flood</strong>wall along the <strong>Potomac</strong> River <strong>Waterfront</strong><br />
Elevated Walkway in the Lower King Street Area<br />
Jones Point Berm<br />
Conceptual designs were prepared for each <strong>of</strong> these flood mitigation alternatives to evaluate the<br />
technical and cost feasibility. Further analysis is presented in Section 6.<br />
3.1.2 Acquire Properties<br />
In recent decades, FEMA’s preferred flood mitigation alternative has increasingly been property<br />
acquisition because, in many cases, it is more cost-effective than large engineered solutions.<br />
Property acquisitions or flood buyouts are the process <strong>of</strong> purchasing flood-prone structures and<br />
demolishing them to eliminate future flood damage claims from those structures. Often these<br />
acquired properties become an amenity for the community through the creation <strong>of</strong> new open<br />
space that can be used to create parks or wildlife areas. It is also a permanent solution for<br />
mitigating those flood hazards.<br />
Various factors should be considered to determine whether or not property acquisition is a viable<br />
mitigation measure in the <strong>City</strong>. Because buyouts are a voluntary measure, a critical factor is the<br />
willingness <strong>of</strong> residents to participate in the program.<br />
To determine acquisition costs the following parameters were estimated: fair market value <strong>of</strong><br />
each property, the number <strong>of</strong> properties likely to require a special survey, and project work<br />
schedule. Average costs were used for property appraisals, real-estate closings, structure<br />
demolition, debris disposal, and legal fees. Administrative costs are also expected to be incurred<br />
for report preparation, overtime, and incidental expenses.<br />
One disadvantage to the acquisition option is that it precludes the preservation <strong>of</strong> historic<br />
buildings. Potential political or socioeconomic implications involved with such a project need to<br />
be considered. Further, potential opposition from property owners reluctant or unwilling to<br />
support the acquisition must be considered.<br />
Acquisition within the study area is a technically feasible alternative, but it is not feasible for<br />
every property. Therefore, a more detailed assessment <strong>of</strong> the study areas is required. While<br />
acquisition may be technically feasible in some study areas, the cost effectiveness <strong>of</strong> this<br />
alternative is highly variable. The cost variability is dependent on characteristics such as real<br />
estate values and flood depths. Therefore, this alternative will be further analyzed in Section 6.<br />
28-JUL-10\\ 3-2
3.1.3 <strong>Flood</strong>pro<strong>of</strong>ing<br />
Overview <strong>of</strong> <strong>Flood</strong> <strong>Mitigation</strong> Measures<br />
<strong>Flood</strong>pro<strong>of</strong>ing is the process <strong>of</strong> modifying a structure or its contents in such a way that the<br />
damages from future flood losses will be reduced or eliminated. The two types <strong>of</strong> floodpro<strong>of</strong>ing<br />
are wet floodpro<strong>of</strong>ing and dry floodpro<strong>of</strong>ing.<br />
Wet floodpro<strong>of</strong>ing involves modifications to a structure so that the contents <strong>of</strong> the structure are<br />
protected when floodwaters enter it. The primary modifications involve elevation or relocation <strong>of</strong><br />
appliances, electrical, and utility systems, as well as use <strong>of</strong> flood-resistant materials inside the<br />
structure. This type <strong>of</strong> floodpro<strong>of</strong>ing is most appropriate for structures that have a basement or<br />
crawl space and a First Floor Elevation (FFE) above the BFE. It is important to note that<br />
flooding will still occur within the structure, so extensive clean up may still be necessary after<br />
flooding events, especially if the floodwaters are contaminated. However, these modifications<br />
can reduce the total damages to structures and their contents.<br />
Dry floodpro<strong>of</strong>ing is the process <strong>of</strong> making the portion <strong>of</strong> a structure that is below a certain flood<br />
elevation watertight. This prevents floodwater from entering the structure and causing damage.<br />
This process involves applying a membrane or coating to the surface <strong>of</strong> the structure as well as<br />
sealing any openings, such as doors and windows, with permanent or removable barriers such as<br />
a floodgate (see Figure 3-1).<br />
Figure 3-1: <strong>Flood</strong>gate<br />
Some risks arise when dry floodpro<strong>of</strong>ing structures. One is that dry floodpro<strong>of</strong>ing is generally<br />
not recommended for structures with basements. This is because these buildings are susceptible<br />
to underseepage, which can create a strong buoyancy force that might damage the structure.<br />
However, floodpro<strong>of</strong>ing structures with basements is considered to some extent for this project<br />
28-JUL-10\\ 3-3
Overview <strong>of</strong> <strong>Flood</strong> <strong>Mitigation</strong> Measures<br />
due to the limited number <strong>of</strong> alternative feasible flood mitigation options. Also, dry<br />
floodpro<strong>of</strong>ing is not recommended for wood frame buildings or other buildings with weaker<br />
construction materials, because these structures are more likely to fail from hydrostatic forces<br />
that result from deep water. Even structures with stronger construction materials, such as brick or<br />
concrete, should not be dry floodpro<strong>of</strong>ed above 3 feet (Figure 3-2).<br />
Figure 3-2: Three-Foot Dry <strong>Flood</strong>pro<strong>of</strong>ing Limitation<br />
The lowest adjacent grade (LAG) for a structure is the lowest ground elevation that is touching<br />
the building (Figure 3-2). This location is generally the first point <strong>of</strong> entry for floodwater (Figure<br />
3-3). Placing fill at this location to increase the elevation <strong>of</strong> the lowest adjacent grade is another<br />
dry floodpro<strong>of</strong>ing technique that may prevent floodwater from entering the building (Figure 3-4).<br />
FLOOD<br />
ELEVATION<br />
3 FT<br />
BASE FLOW<br />
Figure 3-3: <strong>Flood</strong>ed Building<br />
28-JUL-10\\ 3-4
FLOOD<br />
ELEVATION<br />
BASE FLOW<br />
Overview <strong>of</strong> <strong>Flood</strong> <strong>Mitigation</strong> Measures<br />
Figure 3-4: LAG Elevated to Protect Building from <strong>Flood</strong>ing<br />
A raised patio is a patio that would be rebuilt at a new, higher elevation to prevent the flow <strong>of</strong><br />
floodwaters into the structure. Other localized flood barriers can be designed to accomplish the<br />
same effect if a patio is not an option, including localized yard berms and small privacy walls<br />
that are designed to be floodwalls. The raised patio or other localized flood barrier must be<br />
designed by a registered architect, engineer, or other certified pr<strong>of</strong>essional who is responsible for<br />
ensuring that the design prevents flooding.<br />
Two main differences need to be considered when evaluating dry floodpro<strong>of</strong>ing for residential<br />
structures verses for commercial structures. The first difference is that dry floodpro<strong>of</strong>ing a<br />
residential structure does not remove it from the FEMA floodplain and, thus, does not alleviate<br />
the requirement for flood insurance. However, dry floodpro<strong>of</strong>ing can be used to remove<br />
commercial structures from the FEMA floodplain. In addition, for a floodpro<strong>of</strong>ed structure to be<br />
removed from the FEMA floodplain, it is important that any construction that is below the BFE<br />
meet the FEMA criteria for flood damage resistance. For more information, refer to FEMA<br />
Technical Bulletin 2 (August 2008).<br />
Most wall materials, including brick, will leak unless constructed or modified using special<br />
waterpro<strong>of</strong>ing techniques. Care should be taken when applying a sealant to the outside <strong>of</strong> a brick<br />
wall. Waterpro<strong>of</strong>ing compounds can deteriorate or fail if exposed to floodwater for extended<br />
periods <strong>of</strong> time. In addition, sealants may also be subject to damage, particularly in areas that<br />
experience high velocity floodwaters, or waters containing debris or ice.<br />
<strong>Flood</strong>pro<strong>of</strong> membranes or coatings can also affect the aesthetic quality <strong>of</strong> a building. Clear<br />
coatings, such as epoxies and polyurethanes, are generally not as effective as cement or asphalt<br />
based coating. Therefore, the aesthetic appeal <strong>of</strong> a brick wall is lost with the use <strong>of</strong> higher quality<br />
sealants. One way to solve this problem is to add an additional layer <strong>of</strong> brick to the structure with<br />
the sealant located between it and the original brick surface. However, this is not considered an<br />
appropriate technique for historic structures.<br />
<strong>Flood</strong>pro<strong>of</strong>ing the walls <strong>of</strong> a structure by applying a membrane or coating to the surface could be<br />
considered for almost all <strong>of</strong> the floodprone buildings in the study area. However, without careful<br />
care and maintenance, these sealants may still leak. In addition, it is difficult to use this<br />
floodpro<strong>of</strong>ing method without compromising the building aesthetics. Modifications would<br />
require review and approval by the <strong>City</strong>’s Board <strong>of</strong> Architectural Review, since the focus area is<br />
within the designated historic district. Therefore, floodpro<strong>of</strong> membranes or coatings have not<br />
been considered as an option for this study.<br />
28-JUL-10\\ 3-5
Overview <strong>of</strong> <strong>Flood</strong> <strong>Mitigation</strong> Measures<br />
Structure openings can be floodpro<strong>of</strong>ed using permanent or removable shields or valves. Such<br />
openings primarily include doors, windows, and air vents. <strong>Flood</strong>gates are widely available for<br />
floodpro<strong>of</strong>ing both garage doors and pedestrian doors. However, most <strong>of</strong> these are active<br />
systems; requiring installation after a flood warning has been issued. Special floodpro<strong>of</strong> doors<br />
are also available that look and function the same as a regular door (Figure 3-5). Although they<br />
are more expensive than a floodgate, these doors have the advantage <strong>of</strong> being a passive<br />
floodpro<strong>of</strong>ing measure.<br />
Figure 3-5: <strong>Flood</strong>pro<strong>of</strong> Door<br />
It is generally less costly to floodpro<strong>of</strong> windows and air vents. One option for windows is to<br />
remove them and replace with brick. Another possibility is to seal the window shut with<br />
waterpro<strong>of</strong> caulking, which allows the homeowner to retain the aesthetic benefit <strong>of</strong> the window.<br />
A third option is a shield on the outside <strong>of</strong> the window. These are usually made from Plexiglas,<br />
aluminum, or plywood and can be screwed in place or slid into predesigned framed slots. Air<br />
vents can only be floodpro<strong>of</strong>ed through active systems. Two options include a slide-in-place<br />
shield or a watertight adhesive material.<br />
As previously described, dry floodpro<strong>of</strong>ing <strong>of</strong>fers many options. The following dry<br />
floodpro<strong>of</strong>ing options are considered technically feasible in locations within the study area.<br />
<strong>Flood</strong>gates<br />
<strong>Flood</strong>pro<strong>of</strong> openings<br />
Raised patios<br />
Internal elevation <strong>of</strong> contents is another type <strong>of</strong> dry floodpro<strong>of</strong>ing described in Section 3.2.2.<br />
28-JUL-10\\ 3-6
Overview <strong>of</strong> <strong>Flood</strong> <strong>Mitigation</strong> Measures<br />
Since floodpro<strong>of</strong>ing actions will be driven by individual property owners, it is not likely that this<br />
measure will be fully implemented. Therefore, in general, floodpro<strong>of</strong>ing is recommended in<br />
conjunction with other flood mitigation measures.<br />
3.1.4 Elevate Structures<br />
The goal in elevating structures is to raise the first finished floor above the 100-year flood<br />
elevation (extreme flood event). Elevating structures can be accomplished in two ways. A home<br />
or business may be elevated by being lifted <strong>of</strong>f its existing foundation, building a new foundation<br />
to an appropriate height, and resetting the home on the new foundation. The second way to<br />
elevate a structure is to raise the floor inside the house while leaving the outside <strong>of</strong> the house in<br />
its original position. This is only an option for structures with relatively high ceilings or where<br />
the elevation required is small. It may also necessitate abandoning a floor that is below the 100<br />
year flood elevation and moving personal property to a higher floor. This is referred to as<br />
“internal elevation.” Internal elevation is described in Section 3.2.2.<br />
The most suitable structures for elevation are one- or two-story wood frame buildings. Data<br />
obtained from the <strong>City</strong> <strong>of</strong> <strong>Alexandria</strong> showed that most structures in the study area are brick or<br />
masonry buildings that are attached to other structures. Furthermore, the entire study area is<br />
within the Old and Historic <strong>Alexandria</strong> District. Also, most <strong>of</strong> the study area is within the<br />
National Register District. The nature <strong>of</strong> this alternative includes an element <strong>of</strong> risk for historic<br />
buildings that may be unacceptable. There is a possibility <strong>of</strong> excessive cracking taking place<br />
when elevating brick and masonry structures. Also, for those structures to be elevated, any<br />
attached buildings would need to be elevated at the same time, which could be a very complex<br />
process. A further complication to this process is the fact that the entire study area is within the<br />
<strong>City</strong>’s Historic District, so any mitigation work would need to comply with historic preservation<br />
guidelines. Therefore, due to the difficulty and complexity <strong>of</strong> elevating row homes and large<br />
masonry buildings, elevation is not recommended as a flood mitigation alternative.<br />
3.1.5 Increase Inlet and Road Elevations<br />
During extreme tide events, Strand Street, within the <strong>Waterfront</strong> Commercial focus area, is<br />
subject to frequent flooding. Storm sewers are typically designed to quickly convey stormwater<br />
away from roadways. However, in instances where extreme tides back up into the municipal<br />
storm sewer, the storm sewers cannot convey the flow from surface run<strong>of</strong>f. If the storm sewers<br />
back up to an elevation equal to the road surface, the water overflows the catchbasin (inlet) and<br />
the roadway floods. This causes traffic safety issues, which generally requires the <strong>City</strong> <strong>of</strong><br />
<strong>Alexandria</strong> <strong>of</strong>ficials to close the roadway. Closed roadways present further safety issues in<br />
limiting access for emergency vehicles. Other access issues include limiting access to residences<br />
and businesses. Note that this occurs at elevations lower than the nuisance flooding elevation <strong>of</strong><br />
4.0 feet as defined by this study. Areas where the inlet rim elevations (elevation <strong>of</strong> the inlet at the<br />
top, where it intersects the road) were less than 4.0 feet were the focus <strong>of</strong> this alternative.<br />
<strong>Flood</strong>ing that occurs more <strong>of</strong>ten than the nuisance flood can sometimes be remedied by raising<br />
the existing road elevation, as well as the associated inlets and manholes along the road. By<br />
increasing the road and inlet rim elevation, the water back-flowing in the storm sewer must reach<br />
a higher elevation to overtop the catchbasin and flood the road. Design constraints that need to<br />
be analyzed are the elevation <strong>of</strong> the sidewalks and first floors <strong>of</strong> the buildings along the roads.<br />
28-JUL-10\\ 3-7
Overview <strong>of</strong> <strong>Flood</strong> <strong>Mitigation</strong> Measures<br />
The design constraints are derived from the Americans with Disabilities Act requirements and<br />
building first floor elevations, as well as the existing storm drainage around the buildings.<br />
Several years ago, the <strong>City</strong> completed a road elevation project at the intersection <strong>of</strong> Duke Street<br />
and Strand Street. This action was considered moderately effective at reducing nuisance<br />
flooding; therefore, this measure was reviewed for feasibility at King and Strand Streets<br />
(including King Street West to North Union Street and Strand Street South to Wales Alley).<br />
While this measure is not expected to directly reduce property damage, it would reduce the<br />
frequency <strong>of</strong> road flooding and ensure better and safer access to the area. Section 6 summarizes<br />
the concept design for this flood mitigation measure.<br />
3.2 NONSTRUCTURAL MITIGATIONS<br />
In addition to the structural mitigation measures discussed above, three nonstructural mitigation<br />
measures were selected for further evaluation as described in Section 2. Implementation <strong>of</strong> these<br />
measures typically requires less capital expense. However, benefits <strong>of</strong> implementing these<br />
measures are difficult to quantify because they do not reduce flood risk for specific structures.<br />
Therefore, these measures are recommended in tandem with structural flood mitigation<br />
measures. A discussion <strong>of</strong> the nonstructural flood mitigation measures is provided below.<br />
3.2.1 Improve <strong>Flood</strong>plain Zoning Ordinances<br />
The <strong>City</strong> <strong>of</strong> <strong>Alexandria</strong> has a floodplain ordinance in place under the Zoning Ordinance Article<br />
VI Section 6-300. While this ordinance is comprehensive, revisions and additions to the<br />
ordinance can further protect homes and businesses in the floodplain and may qualify the <strong>City</strong><br />
for reduced flood insurance rates through the Community Rating System (CRS).<br />
The CRS is a program administered by FEMA that rewards communities that undertake<br />
floodplain activities beyond the requirements <strong>of</strong> the NFIP. The three goals <strong>of</strong> the CRS are to:<br />
(1) reduce flood losses, (2) facilitate accurate insurance rating, and (3) promote awareness <strong>of</strong><br />
flood insurance. Communities can undertake four CRS Activities: Public Information, Mapping<br />
and Regulations, <strong>Flood</strong> Damage Reduction, and <strong>Flood</strong> Preparedness. The <strong>City</strong> already<br />
participates in the CRS program and expressed interest in exploring additional CRS Activity<br />
credits for the Mapping and Regulations CRS Activity. The following four activities are<br />
recommended for implementation:<br />
Cumulative Substantial Improvements – The NFIP allows improvements or repairs to<br />
existing structures valued at up to 50 percent <strong>of</strong> the building's pre-improvement value to be<br />
permitted without meeting the current flood protection requirements. Over the years, a<br />
community may issue a succession <strong>of</strong> permits for improvements to the same structures. This<br />
can increase the overall flood damage potential within a community as well as the insurance<br />
liability to the Federal Insurance and <strong>Mitigation</strong> Administration. This element provides credit<br />
to a community that tracks the total value <strong>of</strong> all improvements or repairs permitted over the<br />
years to ensure that it does not exceed 50 percent <strong>of</strong> the original value <strong>of</strong> the structure. When<br />
the total value does exceed 50 percent, the original building must be protected according to<br />
the current ordinance requirements for new buildings.<br />
28-JUL-10\\ 3-8
Overview <strong>of</strong> <strong>Flood</strong> <strong>Mitigation</strong> Measures<br />
To receive CRS full credit <strong>of</strong> 45 points, the community must have a system to track<br />
improvements for at least 10 years. However, <strong>Alexandria</strong> could receive 25 CRS points if the<br />
records are accessible for at least five years.<br />
This element may require no specific ordinance language, but simply a policy decision to<br />
interpret the 50 percent improvement threshold as cumulative. In such cases, as required by<br />
the CRS program, documentation must include a legal opinion or directive from the legal<br />
counsel stating how the ordinance is to be interpreted. In any event, the <strong>City</strong> would need to<br />
maintain permit records by parcel number or address, so that the history <strong>of</strong> improvements or<br />
repairs to a particular structure is checked before the next permit is issued.<br />
This element requires that more structures be brought into compliance with the NFIP, thereby<br />
lowering costs from flood damages and decreasing flood insurance rates. There will be an<br />
increased cost for homeowners and business owners who reach the substantial improvement<br />
threshold earlier and will be required to bring their structures into compliance with the<br />
floodplain regulations. For the <strong>City</strong>, costs would be associated with changing the zoning<br />
ordinances and policies and educating permitting <strong>of</strong>ficials on the change.<br />
However, one difficulty expressed by the <strong>City</strong>’s staff is evaluating the value <strong>of</strong> the<br />
improvement in comparison to the value <strong>of</strong> the structure. The <strong>City</strong>’s current ordinance is<br />
written based on NFIP requirements, which calculate the improvement as a percent <strong>of</strong><br />
“market value <strong>of</strong> the structure.” If the <strong>City</strong> were to change the definition within the ordinance<br />
to reflect different measurement criteria, such as square footage, the change may not meet<br />
NFIP requirements. Therefore, it is recommended that the <strong>City</strong> consult with FEMA regarding<br />
the method <strong>of</strong> measuring cumulative improvement values.<br />
Lower Substantial Improvements – This element has the effect <strong>of</strong> requiring more<br />
structures to come into compliance after a disaster, because damage repair is included in<br />
"improvements" under the NFIP rules. The <strong>City</strong> <strong>of</strong> <strong>Alexandria</strong> already includes a 50 percent<br />
substantial improvement threshold. To receive CRS credit for the Lower Substantial<br />
Improvement Threshold, the <strong>City</strong> would need to lower the threshold to less than 50 percent.<br />
For instance, if the regulatory threshold was lowered to 49 percent, the <strong>City</strong> would qualify<br />
for an additional 10 points. If the threshold was lowered to 39 percent, the <strong>City</strong> would qualify<br />
for an additional 50 points.<br />
In a manner similar to the cumulative substantial damages element, this element provides<br />
more flooding protection by requiring more structures be brought into compliance with the<br />
NFIP, thereby lowering costs from damages and decreasing flood insurance rates. However,<br />
it results in an increased cost for homeowners and business owners who reach the lower<br />
substantial improvements threshold earlier and will be required to bring their structures into<br />
compliance with the flood maps. Again, the only costs to the <strong>City</strong> would be associated with<br />
changing the zoning ordinances if necessary and educating permitting <strong>of</strong>ficials on the<br />
change.<br />
Protection <strong>of</strong> Critical Facilities – CRS credit is provided only if regulatory language<br />
protects critical facilities. FEMA defines types <strong>of</strong> critical facilities as follows:<br />
Structures or facilities that produce, use, or store highly volatile, flammable, explosive,<br />
toxic and/or water-reactive materials<br />
28-JUL-10\\ 3-9
Overview <strong>of</strong> <strong>Flood</strong> <strong>Mitigation</strong> Measures<br />
Hospitals, nursing homes, and housing likely to have occupants who may not be<br />
sufficiently mobile to avoid injury or death during a flood<br />
Police stations, fire stations, vehicle and equipment storage facilities, and emergency<br />
operations centers that are needed for flood response activities before, during, and after a<br />
flood<br />
Public and private utility facilities that are vital to maintaining or restoring normal<br />
services to flooded areas before, during, and after a flood<br />
Requiring protection for critical facilities serves several purposes: it reduces damage to vital<br />
public facilities; it reduces pollution <strong>of</strong> flood waters by hazardous materials; and, most<br />
importantly, it ensures that the facilities will be operable during most flood emergencies. To<br />
receive full credit for this element, the regulations must be enforced in the 500-year<br />
floodplain.<br />
On older <strong>Flood</strong> Insurance Rate Maps (FIRMs), the 500-year floodplain is shown as the<br />
Special <strong>Flood</strong> Hazard Area (SFHA) plus Zone B. The ordinance can simply specify the types<br />
<strong>of</strong> facilities prohibited from or protected within Zones A and B. On newer FIRMs with Zones<br />
AE and X, the 500-year floodplain is shown as the SFHA plus the shaded Zone X. In either<br />
case, the 500-year flood elevation becomes the “flood protection elevation” for critical<br />
facilities. If the community enforces critical facility protection regulations in only part <strong>of</strong> its<br />
flood hazard area, e.g., in the floodway or Zone V, the impact adjustment is based on the<br />
500-year floodplain rather than an RF, the area <strong>of</strong> the regulatory floodplain.<br />
Based on our review <strong>of</strong> available Geographic Information System (GIS) data, there are no<br />
critical facilities currently identified in the 500-year floodplain within the study area. To<br />
obtain CRS credit, the <strong>City</strong> can implement a requirement in the regulations to prevent<br />
construction <strong>of</strong> critical facilities in the floodplain. If there are critical facilities or plans to<br />
build new ones, this regulation may not be possible. The fact that no critical facilities are<br />
currently identified in the regulatory floodplain may indicate a <strong>City</strong> policy, but adopted<br />
regulations are required to gain credit for protection <strong>of</strong> critical facilities.<br />
Staff Training – A CRS credit is available when inspectors are Certified <strong>Flood</strong>plain<br />
Managers (CFMs). In addition, increased general knowledge <strong>of</strong> floodplain management<br />
better equips staff to make informed decisions. Therefore, it is recommended that staff<br />
involved in reviewing plans and issuing permits for floodplain development and conducting<br />
field inspections become CFMs.<br />
Training staff involved in reviewing plans and issuing permits as CFMs would increase<br />
enforcement <strong>of</strong> the approved regulations because the staff will have better knowledge <strong>of</strong> the<br />
regulations they are enforcing. The cost <strong>of</strong> training and maintaining the CFM certification for<br />
relevant staff will have to be included in the <strong>City</strong>’s budget.<br />
A maximum <strong>of</strong> 50 points <strong>of</strong> CRS credit is provided if all regulatory staff are CFMs. Twentyfive<br />
points credit is provided for CFM review <strong>of</strong> all proposed development in the floodplain<br />
and associated certificates <strong>of</strong> occupancy. If neither <strong>of</strong> these items is possible, credit is granted<br />
for each staff person who is a CFM or a graduate <strong>of</strong> an NFIP-approved course on floodplain<br />
management, up to 25 points total.<br />
28-JUL-10\\ 3-10
Overview <strong>of</strong> <strong>Flood</strong> <strong>Mitigation</strong> Measures<br />
In addition to these items directly recommended by the CRS program, it is recommended that the<br />
<strong>City</strong> take several other steps to enhance their existing regulations.<br />
Permitting and Inspection – In addition to reviewing permits, it is recommended that the<br />
<strong>City</strong> increase the frequency <strong>of</strong> inspecting new construction to ensure that the work is being<br />
conducted according to the provisions <strong>of</strong> the floodplain ordinance. The ordinance can also be<br />
amended to give the floodplain administrator the right to issue a stop work order or revoke<br />
building permits if the inspections show that a violation has taken place. Sample code from<br />
the <strong>City</strong> <strong>of</strong> Charlotte in Mecklenburg County, NC is shown in Appendix B, Exhibit 1.<br />
This activity would ensure that buildings are constructed in compliance with the building<br />
permits and prevent unauthorized work, such as converting basements into living spaces,<br />
from occurring, thereby reducing flood damages. Costs for the <strong>City</strong> include additional<br />
staffing to support more frequent inspections.<br />
Accessory Structures – It is recommended that additional regulations regarding accessory<br />
structures such as sheds and garages be added to strengthen the existing ordinances. For<br />
example, regulations could prohibit structures from being constructed within the floodplain.<br />
The sample code from Charlotte in Mecklenburg County, NC is shown in Appendix B,<br />
Exhibit 1.<br />
This activity would prevent accessory structures from being constructed in the floodplain,<br />
which would lower costs from damages. Costs for the <strong>City</strong> would be associated with<br />
changing the zoning ordinances and educating permitting <strong>of</strong>ficials on the change.<br />
Variances – A review <strong>of</strong> approved <strong>City</strong> variances indicates that no variances related to<br />
floodplain protection were granted within the last 3 years. However, it is recommended that<br />
the <strong>City</strong> consider strengthening the language to ensure that floodplain variances are<br />
discouraged. The sample code from Roseville, CA is shown in Appendix B, Exhibit 1.<br />
Reducing the number <strong>of</strong> floodplain variances would potentially lower costs from damages by<br />
further minimizing construction within the floodplain areas. There may be an increased cost<br />
for homeowners and business owners who will not be granted variances. For the <strong>City</strong>, the<br />
only costs would be associated with changing the zoning ordinances and educating<br />
permitting <strong>of</strong>ficials on the change.<br />
Regulatory Consistency<br />
During this study, a discrepancy between the <strong>City</strong> <strong>of</strong> <strong>Alexandria</strong>’s floodplain ordinance and<br />
building code was discovered. The specific discrepancy is that under the floodplain ordinance<br />
(Section 6-307), the FFE <strong>of</strong> new or substantially improved structures must be at or above the<br />
BFE. However, the <strong>City</strong>’s Building Code (Section 8-1-2) is more restrictive in that there must be<br />
a minimum freeboard requirement with regards to the FFE.<br />
The <strong>City</strong> <strong>of</strong> <strong>Alexandria</strong> building code states that the <strong>City</strong> has adopted the Virginia Uniform<br />
Statewide Building Code (USBC). Therefore, the USBC is the guiding, legal document when the<br />
<strong>City</strong>’s code does not contain construction specifications. Within the USBC, the flood-resistant<br />
construction provisions <strong>of</strong> the International Building Code (IBC) are specifically adopted.<br />
Therefore, the <strong>City</strong> has effectively adopted the IBC with regards to flood resistant construction.<br />
28-JUL-10\\ 3-11
Overview <strong>of</strong> <strong>Flood</strong> <strong>Mitigation</strong> Measures<br />
The IBC (Section 1612.4) states that “…the design and construction <strong>of</strong> buildings and structures<br />
located in flood hazard areas, including flood hazard areas subject to high velocity wave action,<br />
shall be in accordance with ASCE 24.” This means that all design and construction <strong>of</strong> structures<br />
located in flood hazard areas are governed by the specifications within American Society <strong>of</strong> Civil<br />
Engineers (ASCE) Standard 24. ASCE Standard 24 is titled “<strong>Flood</strong> Resistant Design and<br />
Construction,” and is the guiding document for construction within the floodplain. ASCE 24<br />
states that with the exception <strong>of</strong> Class I structures, which are limited to agricultural, temporary,<br />
and minor storage, all new and substantially improved structures must be designed and built with<br />
a FFE at the BFE plus 1 foot or more.<br />
Therefore, all construction within the Zone AE floodplain <strong>of</strong> the <strong>City</strong> <strong>of</strong> <strong>Alexandria</strong> is required to<br />
meet the more restrictive ASCE 24 design, rather than the NFIP design. FEMA is aware <strong>of</strong> this<br />
inconsistency; currently a guidance document is being prepared that advises communities on<br />
how to deal with this within their floodplain ordinances. However, it is recommended, at a<br />
minimum, that the <strong>City</strong> require conformance to the required building codes, thereby requiring 1<br />
foot <strong>of</strong> freeboard to the FFE. Therefore, the <strong>City</strong>, by reference, requires 1 foot <strong>of</strong> freeboard. It is<br />
recommended that the <strong>City</strong> request that FEMA consider awarding CRS points for this element.<br />
3.2.2 Elevate Internal Supplies and Goods<br />
Elevation <strong>of</strong> supplies, products, or goods above the flooding depth is a type <strong>of</strong> wet floodpro<strong>of</strong>ing<br />
that can be readily implemented and can protect structure contents from flood damage. This<br />
measure would require businesses and residents to realign their internal work and storage areas,<br />
which may affect the function <strong>of</strong> the internal spaces. Although this solution is applicable for<br />
buildings that are flooded by an extreme flood, this mitigation solution focuses on buildings<br />
affected by nuisance flooding because it is believed that business operators and residents that<br />
experience frequent flooding would be willing to restructure their internal spaces.<br />
For this mitigation solution, elevating supplies and utilities to a height <strong>of</strong> approximately 2.5 feet,<br />
which is a standard table or desk height, was considered. Supplies could also be stored in<br />
shelving units or overhead suspension systems that are above that height. Another important<br />
component <strong>of</strong> this solution is outreach and education to residents and business owners who could<br />
benefit by internal elevation.<br />
Approximately 23 structures are located within the area <strong>of</strong> nuisance flooding. Using either the<br />
FFE or the minimum topographic contour, 13 <strong>of</strong> these structures have an FFE at or above the 4foot<br />
contour and are not expected to experience nuisance flooding. An additional two buildings<br />
receive too much flooding for elevation <strong>of</strong> internal supplies to be feasible. The final eight<br />
buildings have flooding depths less than 2.5 feet and would be candidates for this mitigation<br />
measure. All <strong>of</strong> these buildings are commercial properties within the <strong>Waterfront</strong> Commercial<br />
focus area and are listed in Table 3-1.<br />
28-JUL-10\\ 3-12
Overview <strong>of</strong> <strong>Flood</strong> <strong>Mitigation</strong> Measures<br />
Table 3-1: Structures Recommended for Elevation <strong>of</strong> Contents<br />
Min. Contour FFE <strong>Flood</strong>ed<br />
Property ID Address Description (NAVD88) (NAVD88) Depth (ft)<br />
1 065.03-07-04 2 Queen St The Virginia Shop 3.9 - 0.10<br />
2 075.01-05-01 102 S Unions St<br />
Old Dominion Boat<br />
Club<br />
2.0 3.75 0.25<br />
3 075.03-03-02 6 Prince St<br />
Garage with <strong>of</strong>fices<br />
on top<br />
3.7 - 0.30<br />
4 075.01-05-01 100 S Union St Commercial 3.2 3.51 0.49<br />
5 075.01-05-01 6 King St Starbucks C<strong>of</strong>fee 2.4 3.51 0.49<br />
6 075.01-06-11 103 S Union St Mai Thai 2.0 3.51 0.49<br />
7 075.01-03-10 105 King St<br />
Chart House<br />
Restaurant<br />
2.5 - 1.50<br />
8 075.01-04-05 1 King St Shops 2.2 - 1.80<br />
In addition to the structures listed above, internal elevation <strong>of</strong> goods and supplies is also<br />
recommended for consideration for large commercial structures near the waterfront. Section 6<br />
identifies applicable structures for this mitigation measure.<br />
It is recommended that the <strong>City</strong> conduct a site visit to each location to educate the business<br />
owners about this mitigation measure and to determine whether tables, shelving, or a more<br />
complicated suspension system would be options for their businesses. The costs for the <strong>City</strong><br />
would include conducting site visits and providing subsequent support by a <strong>City</strong> employee or<br />
contractor. The business owners will be responsible for the cost <strong>of</strong> the appropriate storage<br />
systems.<br />
3.2.3 Sandbagging and Other Temporary Measures<br />
The <strong>City</strong> currently maintains a sandbag distribution system for affected businesses and<br />
residential areas within the <strong>Potomac</strong> River waterfront area. The <strong>City</strong> provides a predetermined<br />
number <strong>of</strong> sandbags to the residences and businesses located along Union Street and other floodprone<br />
streets, depending on the expected intensity <strong>of</strong> flooding. In addition, several tons <strong>of</strong> loose<br />
sand and empty bags are also available to the residents in a designated location.<br />
The sandbags serve as temporary flood barriers for low flooding depths. Other types <strong>of</strong><br />
temporary measures were researched for applicability. These measures can include inflatable<br />
barriers, frame constructed barriers with watertight membranes, and removable steel or Plexiglas<br />
panels. Although the capital costs for these systems are typically less than for permanent flood<br />
barriers, such as floodwalls, they are active systems that require human interaction. Some <strong>of</strong> the<br />
temporary flood protection systems are complicated, requiring training on proper installation<br />
techniques. These systems typically work well for occasional shallow flooding, or for extending<br />
a permanent flood barrier to a higher elevation, but are not good options in areas with deep<br />
and/or frequent flooding.<br />
Water-inflatable barriers were considered for implementation. These barriers, typically made <strong>of</strong><br />
vinyl coated polyester, are single-tubed devices with an inner restraint baffle. These barriers are<br />
not recommended for use in the <strong>City</strong> because they are high maintenance, use considerable space,<br />
and are difficult to operate. Once inflated, they severely restrict ingress and egress to the<br />
protected area. Also, this measure must be installed by trained technicians, and it is critical that<br />
28-JUL-10\\ 3-13
Overview <strong>of</strong> <strong>Flood</strong> <strong>Mitigation</strong> Measures<br />
the barriers be initially positioned correctly, because once inflated with water, they cannot be<br />
transported. Because the urbanized focus areas do not have sufficient space to set up this flood<br />
barrier, this measure was not considered feasible for the <strong>City</strong>.<br />
No other temporary flood barriers were identified as being suitable for implementation.<br />
Therefore, it is recommended that the <strong>City</strong> maintain the sandbag program and consider the<br />
following changes to the current sandbag guidelines:<br />
The current sandbag distribution areas are relatively small compared to the portions <strong>of</strong> the<br />
waterfront area that are within the boundaries for the nuisance, intermediate, and extreme<br />
flood events. It is suggested to expand the sandbag service areas to include all flood-prone<br />
areas <strong>of</strong> the <strong>Potomac</strong> waterfront. Because the current sandbag distribution plan requires so<br />
much labor effort, these expanded areas could be serviced on a self-serve basis by adding one<br />
additional sand drop <strong>of</strong>f point at 400 North Union Street to the existing drop <strong>of</strong>f point at 500<br />
South Union Street.<br />
The current sandbag guidelines state that “The Directors <strong>of</strong> Emergency Management and<br />
TES [Transportation and Environmental Services] are responsible for determining on a case<br />
by case basis if routine, minor flooding is expected or a large-scale flooding is expected.”<br />
These guidelines rely on the institutional knowledge <strong>of</strong> <strong>City</strong> workers to initiate sandbag<br />
distribution before each event, and could be lost if those workers leave the <strong>City</strong>. While each<br />
flooding event is unique, it is suggested that the <strong>City</strong> develop specific guidelines that could<br />
be used as a framework for determining when to initiate sandbag distribution. These<br />
guidelines could include information about the duration and intensity <strong>of</strong> rainfall, amount <strong>of</strong><br />
snowmelt, expected gage heights along the <strong>Potomac</strong>, and information on approaching<br />
tropical storms.<br />
The <strong>City</strong> provides general information about sandbags on the <strong>Flood</strong>ing Information section<br />
<strong>of</strong> their Web site. It appears that the <strong>City</strong> puts together a press release giving the relevant<br />
information before each potential flooding event. While press releases are a valuable tool,<br />
posting general information about the sandbag program on the Web page could reduce the<br />
number <strong>of</strong> inquiries the <strong>City</strong> receives, as well as informing residents outside <strong>of</strong> the<br />
distribution areas that they may need to make their own provisions for sandbag procurement.<br />
In addition to posting sandbag information, a simple fact sheet or a “common questions about<br />
the sandbagging program” could be developed. Last, the <strong>Flood</strong>ing Information page cannot<br />
be found using the search feature on the <strong>City</strong>’s Web page. Adding this information to the<br />
search tool could make the sandbag information more accessible to Web site users.<br />
3.3 OTHER MEASURES<br />
The section above describes the nonstructural mitigation measures that were selected for detailed<br />
evaluation. Additional nonstructural mitigation measures were identified that were not selected<br />
for detailed analyses. Although these measures did not rank high enough to be evaluated in<br />
detail, many <strong>of</strong> these measures can be implemented relatively simply, with little or no cost<br />
incurred by the <strong>City</strong>. Recommendations for the following non-prioritized measures are provided<br />
in Appendix C:<br />
Improve flapgate operation at outflow points.<br />
28-JUL-10\\ 3-14
Overview <strong>of</strong> <strong>Flood</strong> <strong>Mitigation</strong> Measures<br />
Add backflow preventers in homes to prevent stormwater and sewer backups.<br />
Isolate gas and electrical service lines.<br />
Relocate external electrical boxes.<br />
Improve the <strong>City</strong>’s emergency response.<br />
Inform businesses and residents about NFIP contents coverage.<br />
Improve/enhance existing business identification system.<br />
Provide updated information to residents.<br />
Provide education to area media outlets.<br />
28-JUL-10\\ 3-15
4.1 EXISTING DATA<br />
SECTION FOUR: TECHNICAL ANALYSES SUPPORT<br />
Technical Analyses Support<br />
Key information used in the evaluation potential <strong>of</strong> flood mitigation measures included technical<br />
reference information listed in Section 8, References, and the <strong>City</strong>’s extensive GIS. The <strong>City</strong><br />
maintains a robust GIS that includes topographic data, natural features, planimetrics, utilities,<br />
and other pertinent mapping data. The datum for the GIS is the North American Vertical Datum<br />
<strong>of</strong> 1988 (NAVD88). The <strong>City</strong>’s GIS data were used for all mapping products created for this<br />
study.<br />
The 100-year regulatory floodplain boundary from the <strong>City</strong>’s FIRM is also provided in the <strong>City</strong>’s<br />
GIS. The regulatory FIRM boundaries are the actual boundaries as shown on the FIRM, without<br />
regard to recent topographic data. Therefore, the regulatory floodplain does not necessarily<br />
match the topographic data. A plot <strong>of</strong> the 100-year floodplain elevation on the <strong>City</strong>’s GIS is a<br />
more accurate representation <strong>of</strong> the flood risk. The vertical datum <strong>of</strong> the FIRM is National<br />
Geodetic Vertical Datum <strong>of</strong> 1929 (NGVD29). The conversion to the NAVD88 datum for the<br />
<strong>Alexandria</strong> area is -0.8 feet. Thus, the FEMA 100-year flood elevation <strong>of</strong> 11.0 feet NGVD29 is<br />
10.2 feet NAVD88. Figure 4-1 shows the calculated flood zone compared to FEMA’s regulatory<br />
floodplain boundary. The <strong>City</strong> and FEMA are in the process <strong>of</strong> updating the FIRM to reflect upto-date<br />
topographic data, and these maps were issued in a preliminary state on September 16,<br />
2009.<br />
4.1.1 Building Elevation Data<br />
Knowledge <strong>of</strong> the building elevation data is a key to determining the flood risk to properties. As<br />
described in the Initial <strong>Flood</strong> Assessment report, building elevation data used in this study was<br />
provided by the <strong>City</strong> from their GIS records. The <strong>City</strong>’s data showed over 300 buildings in the<br />
project areas that would be inundated by extreme flood.<br />
To supplement available FFE data, field survey for 35 residential and commercial structures was<br />
conducted. Careful consideration was taken in determining the structures for which additional<br />
survey would be most useful. Since the <strong>Waterfront</strong> Commercial focus area is the most floodprone<br />
location in the project area, first-floor elevations were obtained for all structures in the area<br />
where data were not already available. Outside <strong>of</strong> the <strong>Waterfront</strong> Commercial focus area, most <strong>of</strong><br />
the buildings without known FFEs are residential row houses. Survey was conducted for these<br />
buildings with the assumption that if the FFEs were known for one or two houses in a row, the<br />
others could be reasonably estimated. In addition, a few <strong>of</strong> the available FFEs appeared to be<br />
inconsistent with field reconnaissance information, so some <strong>of</strong> those structures were selected to<br />
be surveyed to verify the accuracy <strong>of</strong> the data.<br />
Elevations were based on NAVD88 and horizontal position was specified in the Virginia<br />
Coordinate System <strong>of</strong> 1983 (VCS83). Control was set using a National Geodetic Survey (NGS)<br />
control monument, Global Positioning System (GPS) 52 (PID HV9658), in Founders Park across<br />
the street from 101 Queen Street.<br />
28-JUL-10\\ 4-1
E LURAY AV<br />
E GLENDALE AV<br />
EARL ST<br />
N PEYTON ST<br />
CLIENT<br />
PROJ<br />
S WEST ST<br />
S PAYNE ST<br />
N WEST ST<br />
ROUNDHOUSE LA<br />
REVISION NO<br />
SCALE<br />
N PEYTON ST<br />
S FAYETTE ST<br />
LESLIE AV<br />
N PAYNE ST<br />
COMMERCE ST<br />
WILKES ST<br />
CAMERON ST<br />
S FAYETTE ST<br />
RICHMOND HY<br />
<strong>City</strong> <strong>of</strong> <strong>Alexandria</strong><br />
DUKE ST<br />
BRADDOCK PL<br />
N FAYETTE ST<br />
N HENRY ST<br />
YEATON AL<br />
EMERSON'S AL<br />
PRINCE ST<br />
PRINCESS ST<br />
MAKELEY AL<br />
S PATRICK ST<br />
N PAYNE ST<br />
OLD TOWN CT<br />
FIRST ST<br />
S PATRICK ST<br />
N PATRICK ST<br />
KING ST<br />
S ALFRED ST<br />
GIBBON ST<br />
GREEN ST<br />
N ALFRED ST<br />
DOWNHAM WY<br />
JEFFERSON ST<br />
CHURCH ST<br />
<strong>Potomac</strong> Waterfron <strong>Flood</strong> <strong>Mitigation</strong> <strong>Study</strong><br />
W:\<strong>City</strong> <strong>of</strong> <strong>Alexandria</strong>\15298470 - Lower King St\Task 3<br />
\Report\Final\Figures\MXDs\F4-1 Fema_flood.mxd<br />
0<br />
1:12000<br />
DES BY<br />
DR BY<br />
CHK BY<br />
N HENRY ST<br />
COLONIAL AV<br />
VERNON ST<br />
WYTHE ST<br />
S COLUMBUS ST<br />
WOLFE ST<br />
FRANKLIN ST<br />
KJM<br />
CJL<br />
MER<br />
FIRST ST<br />
MADISON ST<br />
PENDLETON ST<br />
S WASHINGTON ST<br />
ORONOCO ST<br />
N COLUMBUS ST<br />
WILKES ST<br />
S SAINT ASAPH ST<br />
06/22/07<br />
10/05/09<br />
10/04/09<br />
PORTNER RD<br />
SECOND ST<br />
POWHATAN ST<br />
N WASHINGTON ST<br />
ROSS AL<br />
S SAINT ASAPH ST<br />
S PITT ST<br />
W ABINGDON DR<br />
MONTGOMERY ST<br />
N SAINT ASAPH ST<br />
N PITT ST<br />
QUEEN ST<br />
CAMERON ST<br />
BASHFORD LA<br />
E ABINGDON DR<br />
FIRST ST<br />
TIVOLI PG<br />
PITT ME<br />
S ROYAL ST<br />
0 250 500<br />
Feet<br />
BELLVUE PL<br />
S FAIRFAX ST<br />
SECOND ST<br />
S LEE ST<br />
N ROYAL ST<br />
N FAIRFAX ST<br />
THIRD ST<br />
FIRST ST<br />
S UNION ST<br />
JONES POINT DR<br />
STRAND ST<br />
WHARF ST<br />
ALEXANDER ST<br />
CAPITAL BELTWAY<br />
Legend<br />
Railroad<br />
100-year FEMA elevation (10.2 feet NAVD88)<br />
Buildings<br />
FEMA 100 Year <strong>Flood</strong><br />
FEMA 500 Year <strong>Flood</strong><br />
Datum: NAVD88<br />
P o t o m a c R i v e r<br />
TITLE Calculated <strong>Flood</strong> Zone Compared to FEMA <strong>Flood</strong> Zones<br />
200 Orchard Ridge Drive<br />
Gaithersburg, MD 20878<br />
PROJ NO<br />
15298592<br />
FIGURE<br />
4-1
Technical Analyses Support<br />
The staff identified the FFE and the lowest point <strong>of</strong> entry for each structure and also took<br />
photographs <strong>of</strong> the structures. Property owners were notified that the survey was taking place,<br />
but the surveyors were not able to gain access to the interior <strong>of</strong> most <strong>of</strong> the structures. If they<br />
were not able to access a structure, an FFE was estimated.<br />
FFE survey data were not obtained for all structures located within floodprone areas. If FFE data<br />
were not available for a structure, the FFE was estimated using available topographic data.<br />
Figure 4-2 illustrates structures affected by the nuisance, intermediate, and extreme flood events<br />
based on FFE information (if available) and topographic information. A summary <strong>of</strong> the survey<br />
data can be found in Appendix D as Exhibit 1.<br />
4.1.2 Field Reconnaissance<br />
Several site visits were conducted throughout the course <strong>of</strong> this study. Detailed field visits were<br />
conducted on July 25, 2006 and July 23, 2009. Field visits were conducted to document the<br />
project area through photographs and field notes. First floor elevation data provided by the <strong>City</strong><br />
were evaluated for reasonableness to help identify areas where additional survey would be<br />
beneficial. Assessments were conducted to determine where floodpro<strong>of</strong>ing would be appropriate.<br />
The field visits are summarized in Appendix D as Exhibit 2.<br />
4.2 OVERVIEW OF CULTURAL RESOURCES CONTEXT<br />
Old Town <strong>Alexandria</strong> is enriched by a diverse concentration <strong>of</strong> cultural resources focused around<br />
the waterfront setting. The <strong>Potomac</strong> River serves as the backdrop and focal point <strong>of</strong> the <strong>City</strong>,<br />
which was originally incorporated in 1749. <strong>Alexandria</strong> is defined by, and defines itself by, its<br />
significant number <strong>of</strong> historic properties, including buildings and archeological resources. These<br />
resources, in conjunction with recreational spaces and waterfront viewsheds, enhance the quality<br />
<strong>of</strong> life for residents, commuters, and tourists, and are a highly-valued point <strong>of</strong> pride for the <strong>City</strong>.<br />
Accordingly, in reviewing the potential impacts that the flood mitigation measures could have on<br />
the <strong>City</strong>’s historic properties, the requirements and potential schedule and cost impacts related to<br />
aboveground and belowground cultural resources were considered.<br />
28-JUL-10\\ 4-3
N ALFRED ST<br />
MUIRS CT<br />
S COLUMBUS ST<br />
CLIENT<br />
PROJ<br />
REVISION NO<br />
SCALE<br />
N COLUMBUS ST<br />
S WASHINGTON ST<br />
WOLFE ST<br />
WILKES ST<br />
S SAINT ASAPH ST<br />
PRINCESS ST<br />
GIBBON ST<br />
<strong>City</strong> <strong>of</strong> <strong>Alexandria</strong><br />
N WASHINGTON ST<br />
ORONOCO ST<br />
BROCKETTS AL<br />
S SAINT ASAPH ST<br />
S PITT ST<br />
PRINCE ST<br />
S PITT ST<br />
GREEN ST<br />
N SAINT ASAPH ST<br />
QUEEN ST<br />
DUKE ST<br />
JEFFERSON CT<br />
FRANKLIN ST<br />
JEFFERSON ST<br />
S ROYAL ST<br />
N PITT ST<br />
<strong>Potomac</strong> River <strong>Waterfront</strong> <strong>Flood</strong> <strong>Mitigation</strong> <strong>Study</strong><br />
1 inch = 400 feet<br />
W:\<strong>City</strong> <strong>of</strong> <strong>Alexandria</strong>\15298470 - Lower King St\Task 3<br />
\Report\Final\Figures\MXDs\F4-2 Structure <strong>Flood</strong>ing.mxd<br />
0 DES BY<br />
DR BY<br />
CHK BY<br />
CJL<br />
CJL<br />
MER<br />
09/11/09<br />
09/24/09<br />
10/04/09<br />
S FAIRFAX ST<br />
LEE CT<br />
N ROYAL ST<br />
CAMERON ST<br />
KING ST<br />
S LEE ST<br />
N FAIRFAX ST<br />
RAMSAY AL<br />
SWIFTS AL<br />
POTOMAC ST<br />
0 100 200 400<br />
Feet<br />
TANCIL CT<br />
N LEE ST<br />
WALES AL<br />
BATTERY PL<br />
TOBACCO QY<br />
THOMPSONS AL<br />
POTOMAC CT<br />
TITLE<br />
QUAY ST<br />
CAMERON ME<br />
FAYETTE AL<br />
S UNION ST<br />
S UNION ST WILKES ST<br />
KEITH'S LA<br />
FRANKLIN ST<br />
N UNION ST<br />
STRAND ST<br />
WHARF ST<br />
ALEXANDER ST<br />
THOMPSONS AL<br />
CAMERON ST<br />
WALES AL<br />
Structures Predicted to be <strong>Flood</strong>ed for Each Event<br />
200 Orchard Ridge Drive<br />
Gaithersburg, MD 20878<br />
Legend<br />
<strong>Potomac</strong> River<br />
Buildings affected by:<br />
Nuisance <strong>Flood</strong> (Based on FFE data)<br />
Intermediate <strong>Flood</strong> (Based on FFE data)<br />
Extreme <strong>Flood</strong> (Based on FFE data)<br />
Nuisance <strong>Flood</strong> (Based on topographic data)<br />
Intermediate <strong>Flood</strong> (Based on topographic data)<br />
Extreme <strong>Flood</strong> (Based on topographic data)<br />
Buildings<br />
PROJ NO<br />
FIGURE<br />
4-2<br />
15298592
4.2.1 Local Protection for Historic Properties<br />
Technical Analyses Support<br />
To safeguard its historic assets, the <strong>City</strong> <strong>of</strong> <strong>Alexandria</strong> regulates alterations to designated historic<br />
properties through the Department <strong>of</strong> Planning and Zoning (DPZ). <strong>Alexandria</strong> has several<br />
historic districts that are both nationally and locally designated. All buildings within these<br />
historic districts are legally protected on a local level through administrative review procedures.<br />
The <strong>City</strong> <strong>of</strong> <strong>Alexandria</strong> Master Plan for Historic Preservation states that any building proposed<br />
for construction, reconstruction, alteration, or restoration within the district must be approved by<br />
the Board <strong>of</strong> Architectural Review (BAR). The BAR also has authority over the moving,<br />
removing, encapsulation, and demolition <strong>of</strong> buildings in the district as well as the approval <strong>of</strong><br />
signs (<strong>City</strong> <strong>of</strong> <strong>Alexandria</strong>, 1992). For new construction or renovations within the districts,<br />
compatibility <strong>of</strong> design is currently required for compliance with the <strong>City</strong>’s permitting process<br />
and established design guidelines. Review <strong>of</strong> alterations within the historic district allows for<br />
protection <strong>of</strong> the historic context <strong>of</strong> individual buildings, including settings and viewsheds within<br />
the districts.<br />
All <strong>of</strong> the proposed flood mitigation alternatives are located within the Old and Historic<br />
<strong>Alexandria</strong> District. Coordination at the local level will involve, at minimum, the BAR. The<br />
BAR regulations state that “a Certificate <strong>of</strong> Appropriateness (COA) is required for all new<br />
construction and exterior alterations that are within an historic district and are visible from a<br />
public right <strong>of</strong> way, including those visible from public streets and alleys, waterways, and<br />
parks.”<br />
Any proposed project would also likely trigger review and compliance with Section 11-411:<br />
Archaeology Protection, part <strong>of</strong> the Zoning Ordinance <strong>of</strong> the <strong>City</strong> <strong>of</strong> <strong>Alexandria</strong>, Virginia. Due<br />
to the age <strong>of</strong> the buildings in the project area, some dating to the mid-18 th century, and the<br />
continuous historic occupation <strong>of</strong> the area since then, the potential for the proposed flood<br />
mitigation alternatives to impact archaeological sites, both documented and undocumented, is<br />
high. Any subsurface disturbance within the project area is likely to encounter evidence <strong>of</strong> past<br />
historic and/or potentially prehistoric occupation. Moreover, the waterfront and near-shore areas<br />
are <strong>of</strong> heightened sensitivity given the historic use <strong>of</strong> the area as a port. The adjacency <strong>of</strong> the<br />
<strong>Potomac</strong> River to the project area and the nature <strong>of</strong> the proposed alternatives raise the possibility<br />
<strong>of</strong> nautical as well as terrestrial archaeological investigations.<br />
4.2.2 Federal Protection for Historic Properties<br />
Historic properties are also protected under Section 106 <strong>of</strong> the federal National Historic<br />
Preservation Act (NHPA). Historic properties, as defined in the NHPA, are those buildings,<br />
structures, sites, objects, and districts that are listed in or eligible for listing in the National<br />
Register <strong>of</strong> Historic Places (NRHP). The implementing regulations for Section 106 state that<br />
prior to approval <strong>of</strong> any federally-funded or licensed project, also known as an “undertaking,”<br />
the project’s effects, either direct or indirect, on historic properties is to be taken into account. In<br />
the case <strong>of</strong> adverse affects, federal agencies must seek ways to avoid and minimize these adverse<br />
effects, and if none are found, mitigate the loss to the public. The process, known as Section 106<br />
Review, is laid out in 36 CFR Part 800, and involves consultation with legitimate stakeholders,<br />
including the State Historic Preservation Officer, which in Virginia is the Virginia Department <strong>of</strong><br />
Historic Resources (VDHR). Direct effects include actions that would physically impact a<br />
28-JUL-10\\ 4-5
Technical Analyses Support<br />
resource, while indirect effects can include actions, such as changes in noise or changes to<br />
physical setting, which would diminish the historical integrity <strong>of</strong> a resource.<br />
Although the proposed flood mitigation alternatives would be undertaken by the <strong>City</strong> <strong>of</strong><br />
<strong>Alexandria</strong> or private property owners, one or more alternatives or components <strong>of</strong> these<br />
alternatives may use federal funding, such as a grant from FEMA, or may require a federal<br />
permit, such as one from the United States Army Corps <strong>of</strong> Engineers (USACE). In either case,<br />
the funding or licensing agency would be required to comply with Section 106 <strong>of</strong> the NHPA.<br />
In addition to being a locally designated historic district, the Old and Historic <strong>Alexandria</strong> District<br />
is listed in the NRHP, and as such, any undertaking affecting the district, or any contributing<br />
resource in the district, would trigger Section 106 <strong>of</strong> the NHPA. Because Section 106 applies to<br />
both NRHP-listed and NRHP-eligible properties, other potential historic properties in the project<br />
area would need to be identified by a qualified cultural resource pr<strong>of</strong>essional, and effects on<br />
these properties considered in the process. This applies to both aboveground resources such as<br />
buildings and belowground (archaeological) resources. In both cases, the funding or licensing<br />
federal agency would be responsible for conducting studies to determine what historic properties<br />
are present in the project area.<br />
For aboveground resources such as buildings, pedestrian survey and historical research would be<br />
undertaken, and a formal evaluation made as to whether or not the property meets the criteria for<br />
listing in the NRHP in consultation with VDHR and other stakeholders. For archaeological<br />
investigations in the state <strong>of</strong> Virginia, identification <strong>of</strong> historic properties is completed through a<br />
systematic investigation in the form <strong>of</strong> a Phase I Identification and, if warranted, a Phase II<br />
Evaluation.<br />
If it is determined that an undertaking will have an adverse effect on a historic property,<br />
landscape feature, or archaeological site, then federal agencies are required to consider ways to<br />
avoid or minimize those adverse effects. This may include the relocation <strong>of</strong> the project to avoid<br />
archaeological sites, or redesign to reduce the visibility <strong>of</strong> project components, incorporate<br />
buffers, or use more historically sensitive approaches. If the adverse effects cannot be avoided or<br />
minimized, then the funding or licensing agency must determine appropriate mitigation measures<br />
in consultation with stakeholders and formalize them in a legally-binding Memorandum <strong>of</strong><br />
Agreement. For aboveground historic properties, mitigation measures could include recordation<br />
<strong>of</strong> a historic property through written and photographic documentation, measured drawings,<br />
architectural salvage, or public interpretation through exhibits or Web sites. For archaeological<br />
resources, mitigation <strong>of</strong>ten takes the form <strong>of</strong> Phase III Treatment.<br />
4.3 OVERVIEW OF NATURAL RESOURCES CONTEXT<br />
Projects in <strong>Alexandria</strong> occurring in the <strong>Potomac</strong> River require authorization by USACE Norfolk<br />
District, the Virginia Department <strong>of</strong> Environmental Quality (VDEQ), Virginia Marine Resources<br />
Commission (VMRC) Habitat Management Division, and the <strong>City</strong>. Any proposed construction<br />
on the Virginia shoreline requires both VDEQ and VMRC Water Protection Permits for impacts<br />
to state-owned subaqueous bottom and/or tidal wetlands.<br />
The National Park Service (NPS) owns Jones Point Park and the George Washington Memorial<br />
Parkway. Any work that affects either property would require a temporary construction permit,<br />
28-JUL-10\\ 4-6
Technical Analyses Support<br />
or, if impacts are permanent, approval from the NPS. This includes construction work over or<br />
under the parkway as well as any traffic control measures that impact the parkway.<br />
The area 100 feet landward <strong>of</strong> the top <strong>of</strong> bank on the <strong>Potomac</strong> River is located within a Resource<br />
Protection Area (RPA), which applies to perennial streams in the Chesapeake Bay Watershed.<br />
Activities proposed in the RPA are regulated by the <strong>City</strong> under their Environmental Management<br />
Ordinance. In addition, the District <strong>of</strong> Columbia should be notified <strong>of</strong> work that may affect the<br />
<strong>Potomac</strong> River’s navigable channel.<br />
The proposed construction <strong>of</strong> flood mitigation measures is anticipated to have limited impacts on<br />
upland forest vegetation and forested nontidal wetlands. If the measures are undertaken, they will<br />
require a Clean Water Act Section 404 Individual Permit (IP) Water Quality Certification from<br />
the USACE and Section 10 (Navigable Waters) Authorization. Compensatory mitigation would<br />
be required for unavoidable impacts after implementation <strong>of</strong> avoidance and minimization<br />
measures during the design process. Compensatory mitigation would be required at a 2:1<br />
replacement ratio for forested wetland impacts and should be located within the affected<br />
watershed if possible. Identification <strong>of</strong> appropriate compensation would occur during the<br />
permitting process in consultation with the USACE, VDEQ, and other federal and state resource<br />
agencies, including on-site opportunities, <strong>of</strong>f-site opportunities, regional mitigation banks, and<br />
the Virginia Aquatic Resource Trust Fund.<br />
If federal funds are used for the project, a National Environmental Policy Act (NEPA)<br />
environmental review would be required. The appropriate level <strong>of</strong> environmental analysis<br />
(Categorical Exclusion, Environmental Assessment, Finding <strong>of</strong> No Significant Impact, or<br />
Environmental Impact Statement) required would be determined by the project sponsor. NEPA<br />
requires the sponsor to consider potential environmental consequences <strong>of</strong> the project, document<br />
the analysis, and make the information available to the public for comment before<br />
implementation. NEPA also requires federal agencies to conduct environmental reviews <strong>of</strong><br />
otherwise non-federal projects if those projects include some federal involvement, such as<br />
federal approvals, permitting, or funding.<br />
4.4 REPETITIVE LOSS PROPERTIES<br />
Repetitive loss properties are any insurable building for which two or more flood insurance<br />
claims <strong>of</strong> more than $1,000 were paid by the NFIP within any rolling 10-year period. FEMA<br />
uses this definition to delineate frequently flooded properties. Although there may be other<br />
structures that experience more frequent flooding, repetitive loss properties are specifically<br />
defined by FEMA.<br />
Through the <strong>City</strong>’s participation in the CRS program, mitigating repetitive loss properties is a<br />
specific method to improve the <strong>City</strong>’s score and lower flood insurance rates for property owners<br />
within the <strong>City</strong> <strong>of</strong> <strong>Alexandria</strong>. In addition, mitigating repetitive loss properties reduces future<br />
flood losses and facilitates accurate insurance ratings.<br />
Table 4-1 is a list <strong>of</strong> the repetitive loss properties within the study area:<br />
28-JUL-10\\ 4-7
Table 4-1: Repetitive Loss Properties within <strong>Study</strong> Area<br />
Address Notes FFE (NAVD88)<br />
110 Cameron St<br />
Condos #110, 102, 103, &<br />
104<br />
4.6<br />
1 King St. Boat Club 3.75<br />
6 King St Mai Thai 3.5<br />
101 King St<br />
Same building as 103 King<br />
St<br />
5.0<br />
104 S. Union St -- 3.9<br />
Technical Analyses Support<br />
It should be noted that the FFE listed in the <strong>City</strong>’s repetitive loss database for 110 Cameron<br />
Street appears to be unfinished storage space for all units. Based on our field review, the FFE is<br />
above the extreme flood level. However, since this property has been identified as a repetitive<br />
loss structure by FEMA, flood mitigation measures were identified for this structure.<br />
Section 6 lists flood protection provided for the repetitive loss properties for each structural<br />
mitigation measure. All <strong>of</strong> these properties have a recommended mitigation alternative. This<br />
recommendation may not protect the property from every flood event; however, it will reduce<br />
the frequency <strong>of</strong> flood damages. A reduction in flood damages directly reduces the impact to the<br />
property owner, and the amount <strong>of</strong> time the <strong>City</strong> spends supporting that property owner. In<br />
addition, a reduction in the frequency <strong>of</strong> flood damage is considered by FEMA to be successful<br />
mitigation for a repetitive loss property, thus improving the <strong>City</strong>’s CRS score.<br />
4.5 CONSIDERATION OF SEA LEVEL RISE<br />
Because flood control structures proposed in this study have design lifetimes greater than 10<br />
years, the potential effects <strong>of</strong> climate change on the <strong>Potomac</strong> River were considered. Climate<br />
change is a subtle, yet progressive change in climatic conditions such as temperature and<br />
precipitation over a given period <strong>of</strong> time. Climate data records illustrate a significant climate<br />
shift in the early 1900s, and further studies indicate that climate change is occurring ever more<br />
rapidly, although changes differ regionally and seasonally. Climate change occurs from natural<br />
climatic variations, teleconnections (correlation between oceanic and atmospheric anomalies),<br />
and human activity. Confirmation <strong>of</strong> a global temperature rise comes from the observed<br />
temperature increases in the oceans, observations <strong>of</strong> sea level rise, and diminished snow cover in<br />
the Northern Hemisphere.<br />
A small temperature increase (say 2 o Centigrade [C]), expected by the end <strong>of</strong> the 21 st century,<br />
will drastically impact human life and the future global economy and environment. Global<br />
warming alters the hydrologic balance, resulting in extreme events such as drought and heat,<br />
increase in the power <strong>of</strong> hurricanes, decreased water flow in rivers, melting <strong>of</strong> glaciers, and<br />
increased variability in precipitation and flood risks.<br />
<strong>Flood</strong>ing Issues<br />
Climate change results in increased precipitation intensity and variability, which change the<br />
antecedent conditions <strong>of</strong> river basins and river flows. Higher intensity precipitation events will<br />
significantly increase flood risks. Moreover, rising sea levels will increase flood risks in tidally<br />
28-JUL-10\\ 4-8
Technical Analyses Support<br />
influenced areas. A recent study <strong>of</strong> large basins worldwide (referenced in the Intergovernmental<br />
Panel on Climate Change (IPCC) 2008 Technical Report on Climate Change and Water) showed<br />
that the 100-year flood is projected to occur more frequently.<br />
<strong>Flood</strong> control structures and remedial actions are <strong>of</strong>ten designed in terms <strong>of</strong> a certain flood<br />
frequency. Though the flood frequency is very likely to change under climate change conditions,<br />
very few studies have been done on the assessment <strong>of</strong> change in risk. Additionally, current<br />
global climate models do not have the capability to accurately simulate short-duration rainfall,<br />
and thus cannot predict flood events with high certainty.<br />
Susceptibility to future flood damages will depend significantly on land use decisions, quality <strong>of</strong><br />
flood forecasting, and warning and response systems. Uncertainties lie in projecting future flood<br />
risks, volumes, and damages because <strong>of</strong> uncertainties in future land use, future greenhouse gas<br />
emissions, and hydrologic and global climate models. Additionally, defining changes in floodproducing<br />
rainfall is challenging, because translating large spatial and temporal scale climate<br />
change projections into local flood events presents difficulty. Without credible climate scenarios<br />
that reflect changes in flood producing rainfall events, one cannot estimate the changes in flood<br />
frequency due to climate change and variations. Long-term climate change raises sea levels,<br />
which then may affect tidal flooding. If sea levels continue to rise due to global warming, the<br />
<strong>City</strong> <strong>of</strong> <strong>Alexandria</strong> may need additional protection from flooding. In the near future, increases in<br />
sea-level fluctuations for the <strong>City</strong> <strong>of</strong> <strong>Alexandria</strong> are anticipated to be driven by high tides and<br />
storm surges.<br />
Adaptation<br />
Adaptive management includes operational and demand management and changes in<br />
infrastructure. Adaptations implemented for flood risk preparedness include alteration <strong>of</strong><br />
methods and procedures, such as design standards and calculation <strong>of</strong> climate change allowances.<br />
As more data become available, the local sea-level datum will likely be altered. Future designs<br />
will be affected by both a sea-level datum correction and altered flood maps. It is important to<br />
make sure that local regulations protect residents by identifying the most current standards<br />
available.<br />
<strong>Mitigation</strong><br />
Climate change impacts can be mitigated by adaptation measures that address impacts <strong>of</strong><br />
societal, economic, and management change. Communities must mitigate effects <strong>of</strong> climate<br />
change by minimizing the degree <strong>of</strong> vulnerability to climatic extremes. IPCC’s 2008 Technical<br />
Report on Climate Change and Water provides mitigation strategies to address flooding due to<br />
climate change. <strong>Flood</strong> damages are projected to increase unless current flood management<br />
policies, practices and infrastructure are changed. To adapt and mitigate such impacts,<br />
communities must develop adaptation strategies that minimize the risk under changing<br />
circumstances.<br />
Reducing vulnerability relative to anthropogenic climate change will correspond directly to<br />
strategies for reducing risks associated with natural climate variability. Modification <strong>of</strong> flood<br />
control structures and reservoirs may be necessary to mitigate future flood risks. The longer a<br />
structure’s design lifetime, the greater will be the need to allow for the possible influence <strong>of</strong><br />
28-JUL-10\\ 4-9
Technical Analyses Support<br />
climate change. The USACE provided a policy circular, titled Water Resource Policies and<br />
Authorities Incorporating Sea-Level Change Considerations in Civil Work Programs, dated July<br />
1, 2009, that specifically states: “…engineering designs should consider alternatives that are<br />
developed and assessed for the entire range <strong>of</strong> possible future rates <strong>of</strong> sea-level change.”<br />
The USACE policy discusses the methodology to derive the sea-level rise at a specific location,<br />
which is based on an updated and modified National Research Council report from 1986. The<br />
methodology involves calculating the sea level rise based on location, year project is built, and<br />
expected age <strong>of</strong> project.<br />
The <strong>City</strong> <strong>of</strong> <strong>Alexandria</strong> is a highly urban area, which limits opportunities to provide structural<br />
flood mitigation measures. The floodwall proposed in this study provides 3 feet <strong>of</strong> freeboard<br />
above the 100-year flood elevation to meet FEMA’s levee certification requirements. Three feet<br />
<strong>of</strong> freeboard will accommodate the anticipated sea level fluctuations. However, if the <strong>City</strong><br />
prefers to achieve and retain FEMA levee certification, additional freeboard should be<br />
considered. Consideration <strong>of</strong> sea level rise for the Jones Point berm can be accomplished in the<br />
same manner as the floodwall.<br />
Another large-scale flood control alternative proposed in this study is the elevated walkway. The<br />
elevated walkway height, at an elevation <strong>of</strong> 6.0 feet NGVD, was selected as the maximum<br />
practical height based on topographic information. The intent <strong>of</strong> the elevated walkway is to<br />
mitigate frequent flood events while preserving the look and feel <strong>of</strong> the waterfront; therefore,<br />
increasing the height <strong>of</strong> the elevated walkway to accommodate the sea level fluctuations will<br />
have a direct impact on the intent <strong>of</strong> the project. The proposed road height was also selected<br />
based on topographic constraints; therefore, consideration <strong>of</strong> sea level rise for this measure is not<br />
feasible.<br />
28-JUL-10\\ 4-10
Economic Valuation (Benefit-Cost Analysis)<br />
SECTION FIVE: ECONOMIC VALUATION (BENEFIT-COST ANALYSIS)<br />
5.1 DEFINING THE SCOPE OF ANALYSIS<br />
The economic valuation used in this study is a benefit-cost analysis (BCA). BCA is a technique<br />
to assess the relative desirability <strong>of</strong> competing alternatives in terms <strong>of</strong> economics. BCA is based<br />
on the economic notion <strong>of</strong> efficiency—allocating resources where they have the most added<br />
value to society. BCA does not incorporate the notion <strong>of</strong> equity, which relates to the fairness <strong>of</strong><br />
allocation.<br />
The BCA determines the cost-effectiveness <strong>of</strong> flood mitigation alternatives by calculating the<br />
Benefit Cost Ratio (BCR). The BCR compares the net benefits <strong>of</strong> the project to the total project<br />
cost. This analysis helps select which flood mitigation measures to implement. To determine<br />
whether or not the alternative is cost-effective, benefits should outweigh the costs, resulting in<br />
the BCR equating to at least 1.0. A BCR is not a precise calculation; instead, it relies upon<br />
skilled conservative estimates <strong>of</strong> the parameters involved. The final result should be interpreted<br />
as having a wide error range. The net benefits are derived from the Net Present Value (NPV) <strong>of</strong><br />
the project, thereby incorporating the value the project provides over time.<br />
The BCR was calculated for each <strong>of</strong> the structural mitigation measures. Section 6 summarizes<br />
the analyses for each mitigation measure and compares total expected benefits to the total<br />
expected costs and provides a resultant BCR for each measure within the appropriate area <strong>of</strong><br />
study. As the BCR increases, the likelihood that the mitigation measure will be accepted<br />
increases.<br />
For this study, the benefits were defined as the flood damages mitigated by a specific structural<br />
mitigation alternative. In general, flood damages were divided into direct building damages,<br />
contents damages, and indirect losses. Direct building damages include any damage to the<br />
physical structure, cost <strong>of</strong> replacing utilities (e.g., electrical wiring, telephone), and restoring the<br />
structure to a pre-flood condition. Methodology for valuing residential properties differs from<br />
that <strong>of</strong> commercial properties. For example, content damages were any damages to personal or<br />
commercial property within a structure. For residential properties, contents include furniture,<br />
appliances, housewares, etc. For commercial properties, contents include any <strong>of</strong>fice equipment,<br />
retail stock, etc. Indirect losses were lost income (business losses) or costs incurred by a resident<br />
when they are unable to occupy their home (residential displacement).<br />
The project costs were derived from conceptual designs, specific contractor estimates in the case<br />
<strong>of</strong> certain floodpro<strong>of</strong>ing alternatives, property fair market values, and various administrative<br />
costs. The concept designs were developed using accepted engineering standards and codes,<br />
existing data, and engineering judgment. A unit measurement <strong>of</strong> the total materials and labor<br />
costs is calculated. Finally, unit costs values from national construction cost code guides were<br />
used to created total project costs. For acquisition, the fair market value was the main project<br />
cost. A more detailed discussion regarding the costs for each structural alternative is discussed<br />
later in this section.<br />
Results from the BCA are included as Appendix E.<br />
28-JUL-10\\ 5-1
5.2 CALCULATION OF PROJECT BENEFITS<br />
Economic Valuation (Benefit-Cost Analysis)<br />
The benefits for each mitigation alternative were analyzed at a planning level, so assumptions<br />
were made to simplify the analysis. Instead <strong>of</strong> analyzing all flood depths at a structure for all<br />
flood elevations, each <strong>of</strong> the analyzed discrete flood event’s (extreme, intermediate, and<br />
nuisance) benefits were calculated then summed together. If an alternative did not provide any<br />
mitigation at a specific flood event, then no benefits were calculated.<br />
The following data were used to develop benefits as well as some cost data:<br />
Assessed Value <strong>of</strong> 406 properties (land and building value)<br />
United States Census Bureau Web site for annual business income<br />
Surveyed FFEs<br />
Business questionnaire regarding Hurricane Isabelle<br />
The steps for calculating benefits are outlined below.<br />
1. Determine the <strong>Flood</strong> Depth<br />
Structure FFEs for all potential flood prone structures were compared to the previously<br />
specified flood events (i.e., extreme, intermediate, and nuisance) for the different flood<br />
frequencies.<br />
Example: The home is a 2-story residential building located in the Jones Point study<br />
area. The FFE is 8.47 feet (with basement). The flood depth at the extreme flood event<br />
(10.2 feet NAVD88) in this case would be 1.73 feet.<br />
The following assumptions were made because <strong>of</strong> data limitations:<br />
All residential basements were considered finished.<br />
All basements were assumed to be the first floor flooded.<br />
All commercial buildings were assumed to not have basements.<br />
A comparison between the FFE and the LAG was performed, to determine if the FFE<br />
was the basement or a higher floor. The LAG was determined by known LAG data<br />
(surveyed information) or using the <strong>City</strong> <strong>of</strong> <strong>Alexandria</strong> topography.<br />
If the FFE was lower than the LAG, then the basement was determined to be the FFE;<br />
otherwise, the FFE was reduced by 8 feet to reflect the basement elevation.<br />
2. Calculate the Average Depth (only for residential structures)<br />
For residential structures, the average depth was used for all structures within a study<br />
area. A sensitivity analysis was performed for the Jones Point Area to determine the<br />
disparity between the benefit calculated for each house using individual depth data and<br />
using average depth data. In the final total benefit, only about a four percent difference<br />
occurs. For commercial structures, too many variables occur to make similar<br />
assumptions, so the flooding depth at each event was calculated on a structure-bystructure<br />
basis.<br />
28-JUL-10\\ 5-2
3. Determine the Structure Value<br />
Economic Valuation (Benefit-Cost Analysis)<br />
The assessed value <strong>of</strong> the property, which was obtained from <strong>City</strong> <strong>of</strong> <strong>Alexandria</strong> real<br />
estate data, was used for the structure value instead <strong>of</strong> a Building Replacement Value<br />
(BRV). The individual assessed building price was compared to values obtained from a<br />
standard construction cost guide values (RS Means Residential and Commercial<br />
Replacement Cost Data, 2009) and the assessed value was comparable to the standard<br />
replacement value. In the future, if a detailed, single structure benefit-cost analysis is<br />
conducted, the Building Replacement Value should be used.<br />
4. Determine the Content Value <strong>of</strong> Properties<br />
The content value was calculated using FEMA's standard content values based on<br />
historical insurance claims data for all property types being analyzed. The standard<br />
content value is a percentage <strong>of</strong> the building value based on whether the building is<br />
commercial or residential. Commercial buildings are further delineated based on the type<br />
<strong>of</strong> commercial entity within the building. For mixed use structures, all were commercial<br />
on the first floor, therefore commercial values were used. For residential properties the<br />
content damage was selected to be 100 percent <strong>of</strong> the building value.<br />
5. Determine the Structure and Content Damage<br />
The building and content damage for residential properties was based on depth-damage<br />
curves developed by the USACE. For the commercial properties the source <strong>of</strong> the curve<br />
is HAZUS, FEMA <strong>Mitigation</strong> Planning How-To Guide 32, Understanding Your Risks:<br />
Identifying Hazards and Estimating Losses FEMA 386-2.<br />
6. Determine the Business Income Loss<br />
A major factor in determining benefits for commercial structures is the loss <strong>of</strong> business<br />
income. The loss <strong>of</strong> income is the product <strong>of</strong> the net income for commercial business per<br />
day and the number <strong>of</strong> days <strong>of</strong> functional downtime.<br />
Days <strong>of</strong> business lost information was derived from the business questionnaire,<br />
specifically the responses to how many days the business was out <strong>of</strong> service. The<br />
approximate flooding depth was developed based on Hurricane Isabelle flood elevation<br />
<strong>of</strong> 8.8 feet and the FFE <strong>of</strong> the responder’s business. Table 5-1 summarizes the<br />
information collected relating the flood depths to out-<strong>of</strong>-service days. Responses that<br />
gave extreme values were concluded to be outliers and, therefore, were excluded from the<br />
analysis. Interpolated depths were derived to provide a full range <strong>of</strong> flood depths.<br />
Table 5-1: Estimated Loss <strong>of</strong> Business Time<br />
<strong>Flood</strong><br />
Depth (ft) Out <strong>of</strong> Business (Days)<br />
1 7<br />
2 14<br />
3 21<br />
4 28<br />
5 35<br />
6 42<br />
7 49<br />
28-JUL-10\\ 5-3
Economic Valuation (Benefit-Cost Analysis)<br />
The daily business loss was calculated from United States Census Bureau data,<br />
specifically annual sales data for the <strong>City</strong> <strong>of</strong> <strong>Alexandria</strong>. The data were an average for the<br />
<strong>City</strong> <strong>of</strong> <strong>Alexandria</strong> in that the annual data was converted to daily loss data. Different<br />
business types had different annual data; therefore, each business type was evaluated<br />
individually.<br />
7. Residential Displacement Costs<br />
Residential structures incur displacement costs during the time a resident is unable to<br />
occupy the home including any time for repairs. For residential displacement<br />
calculations, a generic FEMA value was used which is $1.44 per square foot per day <strong>of</strong><br />
displacement. The time the resident would be displaced was calculated to be the same<br />
time as the business losses.<br />
8. Determine the Total Benefit<br />
The total benefit was based on the sum <strong>of</strong> building and content damage, business loss or<br />
residential displacement (as appropriate) for each flood event and mitigation options,<br />
which then was discounted based on the lifetime <strong>of</strong> the project. The discount rate<br />
estimated the present value <strong>of</strong> benefits over the life <strong>of</strong> a project. Seven percent was used<br />
in this study, which is the standard value set by the United States Office <strong>of</strong> Management<br />
and Budget.<br />
1. Simplified Expected Annual Benefit (EAB) calculated for all <strong>of</strong> the<br />
structures in an area:<br />
EAB = (All Structure Damage + All Content Damage + Business Loss +<br />
Displacement) * Expected Annual Probability<br />
The Expected Annual Probability (EAP) is the percent chance <strong>of</strong> that<br />
specific flood level from occurring.<br />
For this study, three flood events were analyzed: nuisance, intermediate,<br />
and extreme. The EAP for the extreme and intermediate were derived<br />
from the return interval discussed in Section 2 <strong>of</strong> this report. The EAP is<br />
effectively the inverse <strong>of</strong> the return interval. For example, the extreme<br />
flood has a return interval <strong>of</strong> 100 years. Therefore, the EAP is 1/100 or<br />
0.1. Table 5-2 summarizes the EAPs for all floods <strong>of</strong> interest in this study:<br />
Table 5-2: Expected Annual Probabilities<br />
<strong>Flood</strong> Stage EAP<br />
Nuisance (4.0 feet) 0.667<br />
Intermediate (8.0 feet) 0.04<br />
Extreme (10.2 feet) 0.01<br />
Pedestrian Walkway Analysis (6.0 feet) 0.1<br />
2. The total benefits were then calculated using the EAB and factoring that<br />
value by the discount rate and the life <strong>of</strong> the project. The following<br />
equation shows how those components are factored together:<br />
28-JUL-10\\ 5-4
Total Benefits<br />
B = EAB<br />
1 <br />
B<br />
<br />
r<br />
Economic Valuation (Benefit-Cost Analysis)<br />
T<br />
1 r<br />
<br />
<br />
T = Estimated amount <strong>of</strong> time (in years) that the mitigation action will be<br />
effective or project lifetime<br />
r = Annual discount rate, 7 percent<br />
5.3 CALCULATION OF PROJECT COSTS<br />
5.3.1 Acquisition<br />
For acquisition, the cost was based upon the fair market value (FMV) <strong>of</strong> the property to be<br />
acquired. To estimate the FMV, the following data from the <strong>City</strong> <strong>of</strong> <strong>Alexandria</strong>’s tax assessment<br />
Web site were used:<br />
Assessed Land Value<br />
Assessed Building Value<br />
Sale Date<br />
Sale Price<br />
Assessed Value at the Time <strong>of</strong> Sale<br />
Year Built<br />
Sales market value ratios were developed for residential and commercial properties in the study<br />
area. The ratio was developed by comparing average sales prices to the assessed value <strong>of</strong> both<br />
the land and building at the time <strong>of</strong> the sale. Separate ratios were developed due to the large<br />
differences between the sales price <strong>of</strong> residential and commercial properties. The FMV was then<br />
the property’s assessed value multiplied by this ratio.<br />
Additional costs in determining the total cost estimate for acquisition include:<br />
Appraisal, Property Survey, and Closing<br />
Structure Demolition (hazardous material removal, demolition)<br />
Legal Fees Related to Contract Review and Settlement<br />
Administrative Costs<br />
These additional costs were estimated based on technical expertise, phone interviews, and<br />
internet research. The costs for property acquisition are summarized in Appendix J.<br />
5.3.2 <strong>Flood</strong>pro<strong>of</strong>ing<br />
Several different options for floodpro<strong>of</strong>ing structures were investigated, as discussed in Section<br />
3. In addition, there were several different sources and methods for determining the cost <strong>of</strong><br />
floodpro<strong>of</strong>ing options. The costs for the floodpro<strong>of</strong>ing options are summarized in Appendix K.<br />
28-JUL-10\\ 5-5
Economic Valuation (Benefit-Cost Analysis)<br />
First, price quotes were obtained from private companies that specialize in floodpro<strong>of</strong>ing<br />
systems, specifically flood gates, internal elevation, and floodpro<strong>of</strong> doors and windows. The cost<br />
<strong>of</strong> elevating patios for floodpro<strong>of</strong>ing was obtained by developing a conceptual design for a<br />
standard residential building and then calculating the units <strong>of</strong> material, equipment, and labor<br />
necessary. The unit cost price was obtained from the 2009 RS Means Construction Cost guide.<br />
The conceptual design included placing fill and the cost to rebuild the patio.<br />
Cost estimates for each floodpro<strong>of</strong>ing option were increased by 50 percent to account for<br />
uncertainty in the conceptual design and estimation <strong>of</strong> units, and to provide a more conservative<br />
cost for the BCR. To be conservative, the most expensive feasible floodpro<strong>of</strong>ing option for each<br />
specific study area was used.<br />
5.3.3 Other Structural <strong>Mitigation</strong> Measures<br />
Cost estimates for the structural mitigation measures, including the Jones Point berm, floodwalls,<br />
elevated pedestrian walkway, and the storm drainage improvements, were based on the<br />
conceptual designs. Material costs for these alternatives were determined from the 2009 RS<br />
Means Construction Cost guide.<br />
In addition to material cost, several other factors were included in the total cost for these other<br />
structural alternatives. Cost estimates for contingency and miscellaneous items were based on 20<br />
percent <strong>of</strong> the total construction costs. Additionally, design costs (preliminary and final) were<br />
based on 20 percent <strong>of</strong> the total project cost. For each alternative, 5 percent <strong>of</strong> the construction<br />
cost with a minimum <strong>of</strong> $50,000 was included to account for mobilization and demobilization <strong>of</strong><br />
construction equipment and staging areas and erosion and sediment control measures.<br />
Permitting costs were also included in the estimate. The permitting costs consider grading plan<br />
approval, cultural resources approval (i.e., historic structures and archeology concerns), and<br />
natural resources permits. In particular, the permitting costs for cultural resources activities have<br />
the potential to vary widely. Our costs include initial archaeological survey, but additional<br />
expense may be incurred, depending on the initial investigations.<br />
Altogether, the sum <strong>of</strong> the above costs represents the total capital expense. Annual maintenance<br />
cost was estimated to be 5 percent <strong>of</strong> the total capital expense, where appropriate.<br />
28-JUL-10\\ 5-6
Economic Valuation (Benefit-Cost Analysis)<br />
Table 5-3: Cultural Resource Approval Relative Schedule, Level <strong>of</strong> Effort, and Cost<br />
<strong>Flood</strong><br />
Pro<strong>of</strong>ing<br />
Jones Point<br />
Berm<br />
100-Year<br />
<strong>Flood</strong> Wall<br />
Elevated<br />
Walkway &<br />
550’ Long<br />
<strong>Flood</strong> Wall<br />
Roadway<br />
Alterations<br />
Adverse<br />
Effects<br />
Scale <strong>of</strong><br />
Adverse<br />
Effects<br />
Local<br />
Review<br />
(Months)<br />
Federal<br />
Review<br />
(Months)<br />
Level <strong>of</strong><br />
Effort,<br />
Local<br />
Level <strong>of</strong><br />
Effort,<br />
Federal<br />
Cost <strong>of</strong><br />
Compliance<br />
Exp.* Mod. 4-12 12-24 Mod. Mod. $20K-$250K<br />
Pos. Mod. 6-12 9-12 Mod. Mod. $40K-$250K<br />
Exp. Sig. 12-24 18-24 Sig. Sig. $100K-$2M<br />
Exp. Sig. 12-24 12-18 Sig. Sig. $100K-$1M<br />
Pos. Mod. 6-12 9-12 Mod. Mod. $50K-$1M<br />
Acquisition/<br />
Demolition<br />
Exp. Sig. 9-12 9-18 Sig. Mod. $100K-$2M<br />
* Table Abbreviations: Exp. = Expected, Pos. = Possible, Mod. = Moderate, Sig. = Significant<br />
28-JUL-10\\ 5-7
6.1 FLOODWALL<br />
Structural <strong>Mitigation</strong> Measure Concepts<br />
SECTION SIX: STRUCTURAL MITIGATION MEASURE CONCEPTS<br />
The largest flood mitigation solution proposed is a concrete floodwall located along the <strong>Potomac</strong><br />
River <strong>Waterfront</strong>, which would protect three <strong>of</strong> the four focus areas from the nuisance,<br />
intermediate, and extreme flood events. The proposed area being protected includes all repetitive<br />
loss structures in the study area.<br />
6.1.1 Description <strong>of</strong> Alternative<br />
The floodwall is proposed to be a concrete structure constructed to an elevation <strong>of</strong> 13.2 feet<br />
(NAVD88). This elevation provides protection against the FEMA 100-year flood elevation <strong>of</strong><br />
10.2 feet plus 3 feet <strong>of</strong> freeboard. In accordance with FEMA regulations, 3 feet <strong>of</strong> freeboard is<br />
required above the 100-year water surface elevation for floodwall structures to be considered as<br />
providing protection against the 100-year flood event. According to FEMA levee requirements,<br />
3.5 feet <strong>of</strong> freeboard is required at the upstream end <strong>of</strong> a levee or floodwall. When analyzing this<br />
alternative for this study, 3 feet <strong>of</strong> freeboard was assumed for planning level purposes for the<br />
entire floodwall.<br />
Before detailed analyses were conducted on the floodwall, five different floodwall layout options<br />
were considered. The options were analyzed based on the amount <strong>of</strong> protection provided, the<br />
feasibility <strong>of</strong> implementation, and the level <strong>of</strong> costs. Figures for each option are provided in<br />
Appendix F as Exhibits 1-1 through 1-5. Of particular importance in selecting the option was the<br />
feasibility <strong>of</strong> conveying interior drainage through the floodwall.<br />
Option 1 consists <strong>of</strong> constructing a floodwall along the <strong>Potomac</strong> River waterfront from Gibbon<br />
Street to the south, to Oronoco Street to the north. The floodwall would be approximately 5,900<br />
feet long. The total interior drainage area behind the floodwall is approximately 82 acres.<br />
<strong>Flood</strong>wall Option 2 would be constructed from Wolfe Street, to the south, to Queen Street, to the<br />
north. This option would be approximately 3,900 feet long. The total drainage area behind the<br />
floodwall would be approximately 50 acres.<br />
Option 3 was similar to Option 1 and would be constructed from Gibbon Street to Oronoco<br />
Street. However, the floodwall would be constructed to the west <strong>of</strong> Founder’s Park on North<br />
Union Street. This floodwall would be approximately 5,800 feet long. The interior drainage area<br />
to the floodwall would be around 77 acres.<br />
<strong>Flood</strong>wall Option 4 was proposed to be constructed from Duke Street to Oronoco Street. The<br />
floodwall would be approximately 4,200 feet long. The approximate interior drainage area for<br />
this alternative would be 59 acres.<br />
The floodwall for Option 5 would be constructed from Wilkes Street to Oronoco Street. This<br />
alternative would be about 5,200 feet long with an approximate interior drainage area <strong>of</strong> 76<br />
acres.<br />
Table 6-1 summarizes the evaluation <strong>of</strong> potential floodwall layout options.<br />
28-JUL-10\\ 6-1
Structural <strong>Mitigation</strong> Measure Concepts<br />
Table 6-1: Comparison <strong>of</strong> Potential <strong>Flood</strong>wall Layout Options<br />
<strong>Flood</strong>wall Option Pros Cons<br />
1. (Gibbon Street to<br />
Oronoco Street)<br />
2. (Wolfe Street to<br />
Queen Street)<br />
Offers protection to all flooded<br />
structures, except the north<br />
Robinson Terminal structure<br />
Provides limited interior drainage<br />
storage areas<br />
Shortest floodwall option,<br />
therefore costs and visual impact<br />
reduced<br />
Avoids potential contamination<br />
at Oronoco Outfall<br />
Minimal interior drainage<br />
(excludes outfalls at Princess,<br />
Queen, Wolfe, between Wolfe<br />
and Wilkes)<br />
Does not require road closures<br />
Most costly option<br />
Requires elevation or<br />
permanent closure <strong>of</strong> Union St<br />
at North and South end<br />
Large interior drainage area<br />
Requires handling <strong>of</strong><br />
potentially contaminated soils<br />
at Oronoco Outfall<br />
Alternate flood mitigation<br />
measures (i.e., floodpro<strong>of</strong>ing)<br />
appear to be feasible for the<br />
residential structures in the<br />
vicinity <strong>of</strong> the north end <strong>of</strong> the<br />
floodwall, therefore large<br />
structural measures are not<br />
likely to be cost effective for<br />
this area<br />
Does not provide protection to<br />
row houses <strong>of</strong>f <strong>of</strong> Quay and<br />
Union; however, floodpro<strong>of</strong>ing,<br />
which is a less expensive<br />
option appears to be feasible<br />
for this area. First floor<br />
elevations are above the<br />
extreme flood event for this<br />
area.<br />
Does not provide protection to<br />
houses <strong>of</strong>f Wilkes and Union;<br />
however, floodpro<strong>of</strong>ing, which<br />
is a less expensive option,<br />
appears to be feasible for this<br />
area. First-floor elevations are<br />
above the extreme flood event<br />
for this area.<br />
Requires elevation <strong>of</strong> Queen St<br />
to tie out with North Lee St<br />
intersection<br />
Potential access problems for<br />
structure at N Union and<br />
Queen<br />
28-JUL-10\\ 6-2
Structural <strong>Mitigation</strong> Measure Concepts<br />
<strong>Flood</strong>wall Option Pros Cons<br />
3. (Gibbon Street to<br />
Oronoco Street,<br />
west <strong>of</strong> Founders<br />
Park)<br />
4. (Duke Street to<br />
Oronoco Street)<br />
5. (Wilkes Street to<br />
Oronoco Street)<br />
Reduces option 1 floodwall by<br />
approximately 200 feet<br />
Avoids disturbance to Founder's<br />
Park<br />
Provides protection to all flooded<br />
structures, except north<br />
Robinson Terminal<br />
One <strong>of</strong> the shorter length<br />
floodwall options<br />
Provides protection for all <strong>of</strong><br />
focus areas (aside from Jones<br />
Point and Robinson Terminal<br />
buildings)<br />
Relatively small interior drainage<br />
(excludes outfall at Duke St.)<br />
Provides protection to all flooded<br />
structures, aside from north<br />
Robinson Terminal<br />
About 700 feet less floodwall<br />
length would need to be<br />
constructed<br />
Requires major reconstruction<br />
or permanent closure to N<br />
Union Street<br />
Potential access problems for<br />
building at N Union and Queen<br />
Requires handling <strong>of</strong><br />
potentially contaminated soils<br />
at Oronoco Outfall<br />
Large interior drainage area<br />
Requires major reconstruction<br />
or permanent closure to N<br />
Union Street<br />
Requires handling <strong>of</strong><br />
potentially contaminated soils<br />
at Oronoco Outfall<br />
Does not <strong>of</strong>fer protection to<br />
houses <strong>of</strong>f Wilkes and Union.<br />
However, floodpro<strong>of</strong>ing, which<br />
is a less expensive option,<br />
appears to be feasible for this<br />
area. First floor elevations are<br />
above extreme flood even in<br />
this area.<br />
One <strong>of</strong> the more costly options<br />
based on the length <strong>of</strong> the wall<br />
and the interior drainage.<br />
Requires handling <strong>of</strong><br />
potentially contaminated soils<br />
at Oronoco Outfall<br />
Second largest interior<br />
drainage area<br />
Could possibly affect<br />
pedestrian tunnel at Wilkes St<br />
Requires elevation <strong>of</strong> N Union<br />
and S Union to reach tie in<br />
After examining each floodwall option, Option 2 was selected as the best layout for<br />
consideration. The proposed floodwall option provides protection for the area from Queen Street<br />
to the north and Wolfe Street to the south (Figure 6-1). The proposed floodwall is 3,900 feet long<br />
and constructed to an elevation <strong>of</strong> 13.2 feet NAVD88. The floodwall would be a reinforced<br />
concrete wall (Appendix F, Exhibit 2-1).<br />
28-JUL-10\\ 6-3
N PITT ST<br />
CLIENT<br />
PROJ<br />
REVISION NO<br />
SCALE<br />
KING ST<br />
S ROYAL ST<br />
PRINCE ST<br />
N ROYAL ST<br />
<strong>City</strong> <strong>of</strong> <strong>Alexandria</strong><br />
S FAIRFAX ST<br />
DUKE ST<br />
N FAIRFAX ST<br />
CAMERON ST<br />
SWIFTS AL<br />
<strong>Potomac</strong> River <strong>Waterfront</strong> <strong>Flood</strong> <strong>Mitigation</strong> <strong>Study</strong><br />
1 inch = 200 feet<br />
W:\<strong>City</strong> <strong>of</strong> <strong>Alexandria</strong>\15298470 - Lower King St\Task 3<br />
\Report\Final\Figures\MXDs\F6-1 <strong>Flood</strong>wall Overall Layout.mxd<br />
0 DES BY<br />
DR BY<br />
CHK BY<br />
CJL<br />
CJL<br />
MER<br />
THOMPSONS AL<br />
RAMSAY AL<br />
09/11/09<br />
09/24/09<br />
10/04/09<br />
S LEE ST<br />
WOLFE ST<br />
POTOMAC CT<br />
PRINCESS ST<br />
N LEE ST<br />
FAYETTE AL<br />
WALES AL<br />
WATERFORD PL<br />
0 50 100 200<br />
Feet<br />
QUAY ST<br />
QUEEN ST<br />
CAMERON ME<br />
S UNION ST<br />
TITLE<br />
S UNION ST<br />
N UNION ST<br />
WALES AL<br />
STRAND ST<br />
STRAND ST<br />
THOMPSONS AL<br />
CAMERON ST<br />
Proposed <strong>Flood</strong>wall Layout<br />
200 Orchard Ridge Drive<br />
Gaithersburg, MD 20878<br />
Legend<br />
Removable <strong>Flood</strong>wall<br />
<strong>Waterfront</strong> <strong>Flood</strong>wall<br />
Pump Stations<br />
Existing Stormdrain and Sewer<br />
WaterType, LifecycleStatus<br />
Sanitary, Active<br />
Storm<br />
Combined<br />
CSO<br />
<strong>Waterfront</strong> <strong>Flood</strong>wall<br />
Sanitary, Abandoned<br />
Combined, Abandoned<br />
Storm, Abandoned<br />
Storm, Removed<br />
Buildings<br />
PROJ NO<br />
FIGURE<br />
6-1<br />
15298592
Structural <strong>Mitigation</strong> Measure Concepts<br />
Due to space constraints, in the waterfront area between Thompson’s Alley and King Street,<br />
reinforced concrete plates would be bolted into the bulkhead to <strong>of</strong>fer protection for the Old<br />
Dominion Boat Club, the Torpedo Factory, and the Chart House (Appendix F, Exhibit 2-2). The<br />
floodwall provides protection for 50 commercial structures and 44 residential buildings.<br />
To prevent flooding behind the proposed floodwall, interior drainage needs to be managed.<br />
Approximately 50 acres drain to the proposed floodwall (Figure 6-2). During the 100-year flood<br />
event, the total volume <strong>of</strong> run<strong>of</strong>f is predicted to be approximately 26 acre-feet. Because no<br />
storage areas are available to temporarily store the stormwater run<strong>of</strong>f, the interior drainage<br />
system needs to convey the entire 100-year flood discharge. A summary <strong>of</strong> flood discharges and<br />
volumes is provided in Table 6-2. Additional information on discharge estimates is provided in<br />
Appendix F as Exhibits 3 and 4.<br />
Table 6-2: <strong>Flood</strong>wall Discharges and Volumes<br />
Recurrence<br />
interval<br />
Area 1<br />
(11 acres)<br />
Area 2<br />
(39 acres)<br />
Q (cfs) Q (cfs)<br />
2 year 40.1 127.4<br />
10 year 56.4 180.8<br />
100 year 81.2 263.3<br />
cfs = cubic foot/feet per second<br />
To adequately protect structures behind the floodwall, three pumping stations are required to<br />
pump the run<strong>of</strong>f from the 100-year flood event. Conceptually, these stations would be installed<br />
close to the floodwall at Thompson Alley, King Street, and Duke Street.<br />
Based on a review <strong>of</strong> the existing storm drainage system, it does not appear to be feasible to<br />
implement a gravity-based stormdrain diversion to reduce the size or number <strong>of</strong> pumping<br />
stations.<br />
6.1.2 Assumptions<br />
Several assumptions were made for the conceptual design <strong>of</strong> a waterfront floodwall. The<br />
floodwall was assumed to be a reinforced concrete wall. Engineering judgment indicates that a<br />
properly sized reinforced concrete wall could withstand the hydrostatic force experienced during<br />
an extreme flood event from the <strong>Potomac</strong> River. An average height <strong>of</strong> 8 feet above ground was<br />
assumed for the reinforced concrete wall. This height was based on the existing ground pr<strong>of</strong>ile<br />
and the height needed to reach an elevation <strong>of</strong> 13.2 feet NAVD88. Based on this height,<br />
dimensions for a reinforced concrete wall were chosen.<br />
28-JUL-10\\ 6-5
22<br />
N PITT ST<br />
22<br />
22<br />
30<br />
20<br />
CLIENT<br />
PROJ<br />
20<br />
22<br />
24<br />
26<br />
22<br />
24<br />
REVISION NO<br />
SCALE<br />
20<br />
20<br />
30<br />
26<br />
32<br />
16<br />
30<br />
S ROYAL ST N ROYAL ST<br />
PRINCE ST<br />
28<br />
30<br />
32<br />
32<br />
34<br />
30<br />
14<br />
34<br />
30<br />
<strong>City</strong> <strong>of</strong> <strong>Alexandria</strong><br />
32<br />
24<br />
16<br />
30<br />
30<br />
34<br />
34<br />
32<br />
S FAIRFAX ST<br />
34<br />
30<br />
28<br />
22<br />
14<br />
24<br />
28<br />
26<br />
30<br />
26<br />
34<br />
34<br />
28<br />
28<br />
34<br />
26<br />
34<br />
N FAIRFAX ST<br />
30<br />
32<br />
34<br />
32<br />
30<br />
30<br />
18<br />
30<br />
26<br />
CAMERON ST<br />
34<br />
32<br />
32<br />
32<br />
28<br />
SWIFTS AL<br />
<strong>Potomac</strong> River <strong>Waterfront</strong> <strong>Flood</strong> <strong>Mitigation</strong> <strong>Study</strong><br />
1 inch = 200 feet<br />
W:\<strong>City</strong> <strong>of</strong> <strong>Alexandria</strong>\15298470 - Lower King St\Task 3<br />
\Report\Final\Figures\MXDs\F6-2 <strong>Flood</strong>wall Drainage Area.mxd<br />
0 DES BY<br />
DR BY<br />
CHK BY<br />
CJL<br />
CJL<br />
MER<br />
34<br />
30<br />
34<br />
18<br />
26<br />
RAMSAY AL<br />
34<br />
32<br />
09/11/09<br />
09/24/09<br />
10/04/09<br />
28<br />
12<br />
30<br />
34<br />
34<br />
22<br />
20<br />
32<br />
22<br />
24<br />
26<br />
26<br />
3 6<br />
THOMPSONS AL<br />
S LEE ST<br />
36<br />
18<br />
18<br />
12<br />
14<br />
34<br />
20<br />
KING ST<br />
DUKE ST<br />
WOLFE ST<br />
POTOMAC CT<br />
24<br />
20<br />
14<br />
14<br />
22<br />
18<br />
10<br />
20<br />
16<br />
N LEE ST<br />
14<br />
16<br />
12<br />
14<br />
16<br />
12<br />
20<br />
16<br />
20<br />
20<br />
16<br />
14<br />
12<br />
20<br />
18<br />
18<br />
16<br />
32<br />
FAYETTE AL<br />
WALES AL<br />
12<br />
0 100 200<br />
50<br />
Feet<br />
16<br />
14<br />
20<br />
10<br />
18<br />
18<br />
8<br />
12<br />
16<br />
16<br />
8<br />
18<br />
PRINCESS ST<br />
TITLE<br />
16<br />
8<br />
32<br />
6<br />
8<br />
10<br />
14<br />
24<br />
26<br />
16<br />
QUAY ST<br />
QUEEN ST<br />
14<br />
28<br />
30<br />
12<br />
14<br />
10<br />
12<br />
8<br />
14<br />
CAMERON ME<br />
S UNION ST<br />
N UNION ST<br />
2<br />
6<br />
6<br />
WALES AL<br />
10<br />
10<br />
4<br />
10<br />
6<br />
8 10<br />
16<br />
STRAND ST<br />
STRAND ST<br />
10<br />
12<br />
6<br />
10<br />
8<br />
8<br />
4<br />
THOMPSONS AL<br />
6<br />
8<br />
14<br />
CAMERON ST<br />
2<br />
6<br />
2<br />
2<br />
14<br />
14<br />
12<br />
10<br />
Interior Drainage Area <strong>of</strong> Proposed <strong>Flood</strong>wall<br />
200 Orchard Ridge Drive<br />
Gaithersburg, MD 20878<br />
10<br />
12<br />
14<br />
8<br />
4<br />
14<br />
Legend<br />
<strong>Waterfront</strong> <strong>Flood</strong>wall<br />
Buildings<br />
<strong>Flood</strong>wall Drainage Area<br />
Area 1<br />
Area 2<br />
2ft Contours<br />
PROJ NO<br />
FIGURE<br />
6-2<br />
15298592
6.1.3 Potential Impacts<br />
Structural <strong>Mitigation</strong> Measure Concepts<br />
The visual and physical obstruction to the view <strong>of</strong> the <strong>Potomac</strong> River is the most significant<br />
impact to such a historic city. Based on the average height, the floodwall could completely block<br />
the view <strong>of</strong> the <strong>Potomac</strong> River in some places. Any <strong>of</strong> several options, if implemented in<br />
conjunction with the floodwall, could minimize the aesthetic disruption to the waterfront. These<br />
options include installation <strong>of</strong> “viewing windows” in the floodwall or building an “invisible<br />
floodwall.” The viewing windows would require installation <strong>of</strong> aquarium glass strong enough to<br />
handle the hydrostatic pressure the wall would experience during the extreme flood event while<br />
still <strong>of</strong>fering viewports <strong>of</strong> the <strong>Potomac</strong> River. The invisible floodwall involves the construction<br />
<strong>of</strong> a concrete base with slots where aluminum planks would be actively placed during the<br />
anticipation <strong>of</strong> a large flood event. This solution could be used when constructing the floodwall<br />
in the areas where it would cross Union Street.<br />
When a flood event is anticipated, the active portion <strong>of</strong> the floodwall would need to be installed,<br />
and access to Union Street at these areas would be closed. By using this flood protection method,<br />
there would be limited access problems encountered along Union Street with the construction <strong>of</strong><br />
a floodwall. This solution would add additional costs, which have been accounted for in the cost<br />
estimate.<br />
Another potential impact <strong>of</strong> constructing a floodwall is access to the waterfront from the<br />
<strong>Potomac</strong> River. Conceptually, the floodwall was planned as a solid wall with no access points to<br />
or from the water. This was to provide complete protection from the <strong>Potomac</strong> River during the<br />
extreme flood event. This would disrupt current boat docking/loading access. One potential<br />
solution is to add access points through an active floodwall system. These access points could be<br />
implemented in a similar way as proposed at Union Street. Sections <strong>of</strong> the wall could be left<br />
open to maintain boat access. Slots for the aluminum planks for the active floodwall system<br />
would need to be constructed. Whenever a flood event is imminent, the planks could be placed in<br />
the wall. This solution would allow limited interference with boating access and protect the<br />
waterfront area during a flood event.<br />
Commercial access will be impacted during construction <strong>of</strong> a floodwall. Coordination is required<br />
with property and business owners to allow enough room to construct the floodwall without<br />
disrupting access to these buildings. Assumed disruptions will be minimized through the use <strong>of</strong><br />
barges to bring in equipment and materials and to perform construction in areas with limited<br />
access. Eight properties are fronted by the proposed floodwall. An estimate for acquiring<br />
permanent easements is included in the cost estimate. However, pedestrian and consumer access<br />
to the waterfront area should be minimally affected during construction <strong>of</strong> the floodwall.<br />
Precautions need to be taken when constructing within contaminated land. The only noted<br />
contamination at this time was at the eastern end <strong>of</strong> Oronoco Street. Contaminated waste from a<br />
manufactured gas plant that was in existence for 95 years is discharged through a pipe near<br />
Founder’s Park. The conceptual design <strong>of</strong> the floodwall separates Founder’s Park from the<br />
<strong>Potomac</strong> River.<br />
28-JUL-10\\ 6-7
6.1.4 Permitting/Approval Requirements<br />
Structural <strong>Mitigation</strong> Measure Concepts<br />
The proposed floodwall requires significant excavation throughout an historic district. Therefore,<br />
environmental, historic, and archaeological permits would be required for construction. The<br />
permitting requirements are anticipated to take a significant level <strong>of</strong> review effort. The local<br />
review schedule may take anywhere between 12 and 24 months and any federal review is<br />
anticipated to take between 18 and 24 months.<br />
Site Plan Approval<br />
Grading associated with the floodwall will require approvals from the <strong>City</strong> <strong>of</strong> <strong>Alexandria</strong> and the<br />
state <strong>of</strong> Virginia as described below. The following is a summary <strong>of</strong> the regulatory programs and<br />
permits anticipated for the project:<br />
Grading plan approval from TES<br />
<strong>City</strong> <strong>of</strong> <strong>Alexandria</strong> Erosion and Sediment Control Ordinance<br />
Virginia Stormwater Management Program (VSMP)<br />
Department <strong>of</strong> Conservation and Recreation (DCR) Construction General Permit<br />
National Park Service Temporary Construction Permit for any work affecting Jones Point<br />
Park or George Washington Memorial Parkway.<br />
Natural Resources<br />
Preliminary estimates <strong>of</strong> the proposed construction footprint and access area (approximately 3.6<br />
acres) indicate that the project may require a Section 404 IP from the USACE as well as a<br />
Section 10 Permit. The construction within the <strong>Potomac</strong> River channel would involve more than<br />
1 acre (approximately 1.8 acres) <strong>of</strong> subaqueous bottom impacts within the <strong>Potomac</strong> River below<br />
the Mean High Water (MHW). The discharge <strong>of</strong> dredge and fill material required for<br />
construction <strong>of</strong> the floodwall occurring channel-ward <strong>of</strong> the MHW would require authorization<br />
by the USACE Norfolk District, the VDEQ, The VMRC, and the <strong>City</strong> <strong>of</strong> <strong>Alexandria</strong>. The area<br />
landward <strong>of</strong> the <strong>Potomac</strong> River, including the proposed project area, is also located within an<br />
RPA, and requires authorization from the <strong>City</strong> under their Environmental Management<br />
Ordinance. A NEPA environmental review may be required if federal funds are used or if the<br />
project includes some federal involvement.<br />
The following list summarizes the water quality permits that may be required for the proposed<br />
project:<br />
Federal<br />
USACE Clean Water Act IP<br />
Section 10 <strong>of</strong> the Rivers and Harbors Act Permit<br />
State<br />
VMRC Habitat Management Division – Subaqueous bottom and/or tidal wetland impact<br />
authorization<br />
28-JUL-10\\ 6-8
VDEQ Section 401 Certification<br />
VDEQ Water Protection Permit<br />
Structural <strong>Mitigation</strong> Measure Concepts<br />
Virginia Coastal Zone Consistency Determination (VA Coastal Zone Management Program)<br />
Local<br />
Chesapeake Bay Preservation Act Authorization (<strong>City</strong> <strong>of</strong> <strong>Alexandria</strong> Environmental<br />
Management Ordinance)<br />
The District <strong>of</strong> Columbia should also be made aware <strong>of</strong> any work that might affect the<br />
navigable channel for the <strong>Potomac</strong> River.<br />
If a NEPA decision document is required before construction begins, the process could require 3<br />
to 12 months to complete. The length <strong>of</strong> time required to develop a NEPA decision document is<br />
tied to the level <strong>of</strong> environmental documentation determined to be appropriate, and to the<br />
respective agency and public involvement processes. After the conclusion <strong>of</strong> the NEPA process,<br />
both the state permit application and local permit acquisition processes are expected to require<br />
approximately 6 to 12 months.<br />
Resource Protection Area (RPA)<br />
The entire floodwall is located within the RPA. Therefore, implementation <strong>of</strong> this project would<br />
require authorization under the <strong>City</strong> <strong>of</strong> <strong>Alexandria</strong>’s Environmental Ordinance (Article XIII).<br />
<strong>Flood</strong> control projects are permittable under this ordinance if approved by the Director <strong>of</strong> TES.<br />
Implementation <strong>of</strong> water quality features such as Low Impact Development measures may be<br />
required.<br />
Cultural Resources<br />
Aboveground Resources<br />
This floodwall will be considered to have an indirect adverse effect on the physical setting <strong>of</strong> the<br />
historic district or other individual historic properties, which may diminish the integrity <strong>of</strong> the<br />
resources within the viewshed. The scenic viewsheds <strong>of</strong> the waterfront are a contributing<br />
landscape feature to the Old and Historic <strong>Alexandria</strong> District. The floodwall will reduce or<br />
eliminate the scenic viewshed and will have an adverse effect on the historic district.<br />
Archaeological Resources<br />
A Phase I Archaeological Survey (background research and close interval shovel testing at 10<br />
meters) would likely be triggered. Moreover, if floodwall construction would impact the existing<br />
bulkheads requiring marine construction, assessment <strong>of</strong> underwater archaeological resources will<br />
be triggered. Because <strong>Alexandria</strong> is a port city <strong>of</strong> great historic significance, resources at the<br />
waters edge or near shore would also be subject to NHPA Section 106 review, as it is likely that<br />
they would be negatively affected by additional bulkheading, dredging, or marine construction<br />
activities related to flood barrier construction.<br />
A Phase I Identification study involving background research and shovel testing within the area<br />
<strong>of</strong> direct effect will be required. This could involve a detailed historical study <strong>of</strong> the <strong>Alexandria</strong><br />
waterfront to determine areas <strong>of</strong> previous use and the potential for water-related infrastructure<br />
28-JUL-10\\ 6-9
Structural <strong>Mitigation</strong> Measure Concepts<br />
such as wharfs, cribbing, landings, and docks. Other survey methods may also be necessary, such<br />
as a side-scan sonar survey <strong>of</strong> the near shore areas or underwater documentation and/or<br />
excavation <strong>of</strong> sites that would be disturbed or destroyed by this undertaking. Installation <strong>of</strong><br />
floodwater-handing systems such as pumps would also likely trigger Phase I testing before<br />
installation and Archaeological Monitoring during construction.<br />
If archaeological features are identified, a Phase II (Evaluation) follows and if the archaeological<br />
features would be adversely affected by the floodwall construction then Phase III (Treatment)<br />
would be required and would likely involve recordation and data recovery excavations.<br />
6.1.5 BCA and Results<br />
The cost <strong>of</strong> the floodwall is based on construction (materials, labor, and equipment), final design,<br />
permitting, acquisition <strong>of</strong> private property or easements, and administrative costs. The total<br />
upfront capital expense <strong>of</strong> this project is approximately $15,463,000. An annual maintenance fee<br />
<strong>of</strong> 2.5 percent <strong>of</strong> the total cost <strong>of</strong> the floodwall was added to the cost <strong>of</strong> the project. The present<br />
cost for the annual maintenance <strong>of</strong> the floodwall is about $3,400,000. The total cost <strong>of</strong> the<br />
project used in the benefit-cost analysis (BCA) would be about $18,863,000. A more detailed<br />
cost estimate is provided in Exhibit 3 <strong>of</strong> Appendix F.<br />
The total benefits provided by the floodwall, as shown in Table 6-3, will be $12,196,000. This<br />
value was derived from the study areas protected by the floodwall, which include all <strong>of</strong> the<br />
Commercial <strong>Waterfront</strong> with the exception <strong>of</strong> the northern Robinson Terminal, all <strong>of</strong> the King<br />
Street study area, and the Cameron Mews sections <strong>of</strong> the North Union Street focus area. The<br />
project lifetime is 50 years based on standard USACE and FEMA structural mitigation design<br />
lifetimes.<br />
The BCR for the elevated walkway is 0.65, which indicates that this is not a cost-beneficial<br />
mitigation project.<br />
6.2 ELEVATED WALKWAY<br />
Table 6-3: <strong>Flood</strong>wall Benefit-Cost Ratio<br />
Total Cost <strong>of</strong> <strong>Flood</strong>wall including<br />
construction, design, and permitting<br />
$18,863,273<br />
Total Benefit for <strong>Flood</strong>wall $12,196,000<br />
Benefit-Cost Ratio (BCR) for Structures<br />
protected by the <strong>Flood</strong>wall<br />
One structural option being analyzed for flood protection in the <strong>City</strong> <strong>of</strong> <strong>Alexandria</strong> is an elevated<br />
walkway along the waterfront <strong>of</strong> the <strong>Potomac</strong> River. The principal element <strong>of</strong> the elevated<br />
walkway is a low pr<strong>of</strong>ile floodwall at elevation 6 feet (NAVD88), which would protect the area<br />
from nuisance flooding but not the intermediate or the extreme flood events. The area being<br />
protected includes several repetitive loss structures in the study area.<br />
0.65<br />
28-JUL-10\\ 6-10
6.2.1 Description <strong>of</strong> Alternative<br />
Structural <strong>Mitigation</strong> Measure Concepts<br />
The proposed elevated walkway would be constructed to an elevation <strong>of</strong> 6 feet (NAVD88) and a<br />
length <strong>of</strong> 1,280 feet. The length <strong>of</strong> the elevated walkway provides protection for the lower King<br />
Street and Strand Street area (Figure 6-4). The elevated walkway plan is similar to the floodwall<br />
in terms <strong>of</strong> design and construction materials. Figure 6-3 provides an example <strong>of</strong> an elevated<br />
walkway cross-section. The proposed 5-foot-wide pedestrian path would be constructed on the<br />
backfill <strong>of</strong> the floodwall. The pedestrian path is not critical for flood protection, but it would help<br />
maintain pedestrian access to the water’s edge and the viewshed.<br />
Figure 6-3: Proposed Elevated Walkway Example Cross-Section<br />
This alternative provides protection from frequent flooding while maintaining a scenic walkway<br />
along the <strong>Potomac</strong> River. The elevated walkway is proposed to have the following dimensions:<br />
An average height <strong>of</strong> 4 feet (to reach an elevation <strong>of</strong> 6 feet NAVD88)<br />
A base <strong>of</strong> 5.5 feet<br />
A varying thickness averaging 1.5 feet<br />
For planning purposes, the walkway was designed to be composed <strong>of</strong> asphalt and have a width <strong>of</strong><br />
5 feet, to accommodate two-way pedestrian traffic. Other materials, such as composite materials,<br />
to replicate a boardwalk could be substituted, but they were not included in this estimate.<br />
To prevent flooding behind the proposed floodwall, interior drainage needs to be managed. The<br />
run<strong>of</strong>f volume generated by the approximately 28-acre drainage area for a 100-year storm<br />
(Figure 6-5) is approximately 14.9 acre-feet. Therefore, the design concept includes pumping<br />
stations that would pump the 100-year event into the <strong>Potomac</strong> River in the event the flapgates are<br />
sealed or blocked.<br />
To reduce the pumping required for this alternative, a proposed stormwater diversion is proposed<br />
for the elevated walkway drainage area. The proposed concept diverts run<strong>of</strong>f from Prince Street,<br />
28-JUL-10\\ 6-11
Structural <strong>Mitigation</strong> Measure Concepts<br />
Duke Street, South Union Street, and King Street around the elevated walkway and discharge<br />
into the <strong>Potomac</strong> River. About 1,470 feet <strong>of</strong> 42-inch concrete pipes is required to tie into the<br />
existing stormwater system. Two inlets would also be installed near the corner <strong>of</strong> King Street and<br />
The Strand to capture run<strong>of</strong>f from King Street. This stormwater diversion reduces the drainage<br />
area behind the elevated walkway that would need to be pumped out and is shown on Figure 6-4.<br />
28-JUL-10\\ 6-12
CLIENT<br />
PROJ<br />
RAMSAY AL<br />
SWIFTS AL<br />
S LEE ST<br />
REVISION NO<br />
SCALE<br />
THOMPSONS AL<br />
WOLFE ST<br />
DUKE ST<br />
<strong>City</strong> <strong>of</strong> <strong>Alexandria</strong><br />
N LEE ST<br />
CAMERON ST<br />
WALES AL<br />
FAYETTE AL<br />
KING ST<br />
WATERFORD PL<br />
PRINCE ST<br />
QUEEN ST<br />
CAMERON ME<br />
S UNION ST<br />
<strong>Potomac</strong> River <strong>Waterfront</strong> <strong>Flood</strong> <strong>Mitigation</strong> <strong>Study</strong><br />
1 inch = 150 feet<br />
W:\<strong>City</strong> <strong>of</strong> <strong>Alexandria</strong>\15298470 - Lower King St\Task 3\Report<br />
\Final\Figures\MXDs\F6-4 Walkway Overall Layout.mxd<br />
0 DES BY<br />
DR BY<br />
CHK BY<br />
CJL<br />
CJL<br />
MER<br />
09/11/09<br />
09/24/09<br />
10/04/09<br />
WALES AL<br />
N UNION ST<br />
STRAND ST<br />
STRAND ST<br />
THOMPSONS AL<br />
CAMERON ST<br />
0 37.5 75 150<br />
Feet<br />
TITLE<br />
Proposed Elevated Walkway Layout<br />
200 Orchard Ridge Drive<br />
Gaithersburg, MD 20878<br />
Legend<br />
Proposed Elevated Walkway<br />
Proposed 550 foot <strong>Flood</strong>wall<br />
Proposed Pump Stations<br />
Proposed Flap Gates<br />
Proposed Inlets<br />
Proposed Stormdrains<br />
Existing Stormdrain and Sewer<br />
Sanitary, Active<br />
Storm<br />
Combined<br />
CSO<br />
Sanitary, Abandoned<br />
Combined, Abandoned<br />
Storm, Abandoned<br />
Storm, Removed<br />
Buildings<br />
550 foot <strong>Flood</strong>wall<br />
Elevated Walkway<br />
PROJ NO<br />
FIGURE<br />
6-4<br />
15298592
28<br />
28<br />
32<br />
30<br />
32<br />
CLIENT<br />
PROJ<br />
26<br />
32<br />
24<br />
REVISION NO<br />
SCALE<br />
Legend<br />
22<br />
32<br />
20<br />
18<br />
30<br />
22<br />
22<br />
30<br />
20<br />
20<br />
22<br />
Proposed Elevated Walkway<br />
Proposed 550 foot floodwall<br />
Proposed Pump Stations<br />
Proposed Flap Gates<br />
Proposed Inlets<br />
Proposed Stormdrain<br />
Drainage Area<br />
Duke Street - Post Diversion<br />
<strong>Flood</strong>wall<br />
King Street - Post Diversion<br />
Area to be pumped out<br />
2ft Contours<br />
N PITT ST<br />
Buildings<br />
PITT ME<br />
24<br />
26<br />
20<br />
20<br />
KING ST<br />
PRINCE ST<br />
22<br />
26<br />
24<br />
<strong>City</strong> <strong>of</strong> <strong>Alexandria</strong><br />
S ROYAL ST<br />
28<br />
18<br />
32<br />
N ROYAL ST<br />
30<br />
16<br />
30<br />
32<br />
34<br />
30<br />
32<br />
30<br />
14<br />
34<br />
32<br />
24<br />
16<br />
30<br />
30<br />
34<br />
34<br />
32<br />
S FAIRFAX ST<br />
<strong>Potomac</strong> River <strong>Waterfront</strong> <strong>Flood</strong> <strong>Mitigation</strong> <strong>Study</strong><br />
1 inch = 200 feet<br />
W:\<strong>City</strong> <strong>of</strong> <strong>Alexandria</strong>\15298470 - Lower King St\Task 3\Report<br />
\Final\Figures\MXDs\F6-5 Walkway Interior Drainage.mxd<br />
0 DES BY<br />
DR BY<br />
CHK BY<br />
34<br />
28<br />
22<br />
CJL<br />
CJL<br />
14<br />
MER<br />
26<br />
28<br />
30<br />
28<br />
34<br />
28<br />
34<br />
34<br />
26<br />
34<br />
32<br />
30<br />
34<br />
30<br />
CAMERON ST<br />
N FAIRFAX ST<br />
34<br />
09/11/09<br />
09/25/09<br />
10/04/09<br />
32<br />
30<br />
26<br />
32<br />
34<br />
28<br />
SWIFTS AL<br />
32<br />
32<br />
34<br />
32<br />
30<br />
34<br />
18<br />
26<br />
26<br />
28<br />
30<br />
12<br />
36<br />
34<br />
34<br />
22<br />
20<br />
32<br />
34<br />
24<br />
22<br />
26<br />
3 6<br />
THOMPSONS AL<br />
RAMSAY AL<br />
S LEE ST<br />
30<br />
18<br />
18<br />
12<br />
14<br />
34<br />
DUKE ST<br />
WOLFE ST<br />
POTOMAC CT<br />
0 50 100 200<br />
Feet<br />
20<br />
24<br />
20<br />
14<br />
14<br />
TITLE<br />
22<br />
18<br />
10<br />
16<br />
N LEE ST<br />
14<br />
20<br />
14<br />
12<br />
14<br />
16<br />
12<br />
20<br />
12<br />
16<br />
20<br />
20<br />
16<br />
12<br />
20<br />
18<br />
18<br />
16<br />
32<br />
FAYETTE AL<br />
16<br />
WALES AL<br />
16<br />
14<br />
20<br />
10<br />
8<br />
12<br />
18<br />
16<br />
24<br />
8<br />
18<br />
PRINCESS ST<br />
QUEEN ST<br />
32<br />
8<br />
6<br />
8<br />
10<br />
16<br />
14<br />
16<br />
QUAY ST<br />
S UNION ST<br />
26<br />
28<br />
16<br />
14<br />
CAMERON ME<br />
18<br />
30<br />
12<br />
N UNION ST<br />
14<br />
10<br />
12<br />
8<br />
14<br />
2<br />
8<br />
6<br />
16<br />
6<br />
WALES AL<br />
STRAND ST<br />
10<br />
10<br />
4<br />
STRAND ST<br />
10<br />
10<br />
6<br />
10<br />
8<br />
6<br />
4<br />
6<br />
8<br />
8<br />
THOMPSONS AL<br />
14<br />
CAMERON ST<br />
Interior Drainage Area for Elevated Walkway<br />
200 Orchard Ridge Drive<br />
Gaithersburg, MD 20878<br />
2<br />
6<br />
2<br />
2<br />
14<br />
14<br />
10<br />
12<br />
550 foot <strong>Flood</strong>wall<br />
14<br />
8<br />
14<br />
10<br />
12<br />
4<br />
14<br />
Elevated Walkway<br />
PROJ NO<br />
FIGURE<br />
6-5<br />
15298592
Structural <strong>Mitigation</strong> Measure Concepts<br />
The pumping stations would be installed at the roads that run perpendicular to the floodwall. The<br />
pumping stations would need to be capable <strong>of</strong> pumping out the run<strong>of</strong>f from the extreme flood<br />
event. Because no storage areas are available to temporarily store the stormwater run<strong>of</strong>f, the<br />
interior drainage system needs to convey the entire 100-year flood discharge. A summary <strong>of</strong><br />
flood discharges and volumes is provided in Table 6-4. Additional information on discharge<br />
estimates is provided in Exhibit 3 <strong>of</strong> Appendix G. The pump stations would be located next to<br />
the intersection <strong>of</strong> King Street and Strand Street, and along Duke Street just east <strong>of</strong> Strand Street.<br />
Table 6-4: Elevated Walkway Discharges and Volumes<br />
King Street,<br />
Area (19.1 ac)<br />
Duke Street<br />
Area (4.0 ac)<br />
Remainder<br />
Area (4.8 ac)<br />
Additional <strong>Flood</strong>wall<br />
Area (3.5 ac)<br />
Recurrence<br />
interval Q (cfs) Q (cfs) Q (cfs) Q (cfs)<br />
2 year 56.3 11.9 14.1 10.1<br />
10 year 103.5 22.7 26.8 19.2<br />
100 year 148.6 32.3 38.1 27.3<br />
ac = acre<br />
cfs = cubic foot/feet per second<br />
An additional section <strong>of</strong> floodwall is required to provide protection for this area. On the south<br />
side <strong>of</strong> the Torpedo Factory the existing drainage system is lower than the 6-foot design<br />
elevation for the pedestrian walkway. In this area, flooding begins to occur at an elevation <strong>of</strong> 3.2<br />
feet at Queen Street and Thompsons Alley (Figure 6-4). Without this additional floodwall, the<br />
benefits for the elevated walkway would be greatly reduced, as the flooding would back up and<br />
flood the area protected by the pedestrian walkway. The proposed floodwall would have<br />
dimensions similar to the elevated walkway. However, the additional floodwall would be<br />
approximately 550 feet and would not include a pedestrian walkway. The 550-foot floodwall<br />
with sloped backfill would have the following dimensions:<br />
An average height <strong>of</strong> 3 feet above ground (to reach an elevation <strong>of</strong> 6 feet NAVD88)<br />
A base <strong>of</strong> 3.3 feet<br />
A varying thickness averaging 1.5 feet<br />
Additional internal drainage measure would need to be addressed for the additional floodwall.<br />
Approximately 3.5 acres that drain to this section <strong>of</strong> floodwall would result in a run<strong>of</strong>f volume <strong>of</strong><br />
0.94 acre-feet during the 10-year storm event (Figure 6-5). During periods <strong>of</strong> low elevation in the<br />
<strong>Potomac</strong> River, the existing stormdrain would flow by gravity through a proposed flapgate.<br />
During periods <strong>of</strong> high elevation on the <strong>Potomac</strong> River, a pumping system capable <strong>of</strong> pumping<br />
the peak discharge from the 10-year storm is proposed at this location. Appendix G contains<br />
additional information for the elevated walkway concept, including representative sections <strong>of</strong> the<br />
walls.<br />
28-JUL-10\\ 6-15
6.2.2 Assumptions<br />
Structural <strong>Mitigation</strong> Measure Concepts<br />
Several assumptions were made when conceptually designing the elevated walkway and 550foot<br />
floodwall. Both the elevated walkway and the 550-foot floodwall were assumed to be<br />
reinforced concrete retaining wall. The elevated walkway was assumed to have a level backfill,<br />
due to the need for enough room on top <strong>of</strong> the retaining wall to place a pedestrian walkway. The<br />
550-foot floodwall was assumed to be sloped backfill to minimize impacts on the structures it<br />
would be protecting. An average height <strong>of</strong> 4 feet and 3 feet was assumed for the elevated<br />
walkway and the 550-foot floodwall, respectively. The height was determined from the existing<br />
land pr<strong>of</strong>ile on which the elevated walkway and 550-foot floodwall would be constructed.<br />
The walkway itself was assumed to have a width <strong>of</strong> 5 feet. This assumption was made based on<br />
Federal Highway Administration regulations <strong>of</strong> sidewalks being, at minimum, 5 feet wide to<br />
accommodate two-way pedestrian traffic.<br />
Also, there was assumed to be no potential storage areas for the stormwater run<strong>of</strong>f behind the<br />
elevated walkway and the 550-foot floodwall. Available contour information indicates very<br />
limited storage space is available for stormwater run<strong>of</strong>f below the height <strong>of</strong> the lowest FFE in the<br />
area (e.g., Mai Thai Restaurant and Starbucks FFE are at an elevation <strong>of</strong> 3.51 feet NAVD88).<br />
6.2.3 Potential Impacts<br />
A potential impact as a result <strong>of</strong> the elevated walkway and 550-foot floodwall is aesthetics. The<br />
conceptual design indicates that the waterfront view <strong>of</strong> the <strong>Potomac</strong> River could be obstructed in<br />
certain places. However, because there will be pedestrian access, the waterfront view will still be<br />
available.<br />
Boating access to the waterfront could potentially be impacted by the elevated walkway and the<br />
550-foot floodwall. To account for access along the waterfront, ramps from the walkway to the<br />
piers and docks would need to be included. These items were not accounted for in the conceptual<br />
design and would add cost to the overall project.<br />
Furthermore, several commercial buildings could be affected during construction <strong>of</strong> the elevated<br />
walkway and the 550-foot floodwall. There would need to be coordination between the<br />
<strong>Alexandria</strong> Yacht Warehouse, <strong>Potomac</strong> Arms, the Old Dominion Boat Club, and the Chart<br />
House. These businesses would be impacted by having either the elevated walkway or the 550foot<br />
floodwall between them and the <strong>Potomac</strong> River.<br />
The floodwall may block the existing pedestrian walkway in the vicinity <strong>of</strong> Thompson Alley.<br />
Access issues will need to be addressed in this area and may require a removable system be<br />
installed. This system would need to be installed within 24 hours <strong>of</strong> known tidal or flood events.<br />
For the Old Dominion Boat Club, ramps from the walkway to their piers and docks would need<br />
to be provided. Other possibilities would be to align the walkway to the south and west <strong>of</strong> the<br />
building and connect to the eastern side <strong>of</strong> the Torpedo Factory. Neither <strong>of</strong> these options was<br />
included in the proposed design; therefore, the costs may be higher with either option.<br />
28-JUL-10\\ 6-16
6.2.4 Permitting/Approval Requirements<br />
Structural <strong>Mitigation</strong> Measure Concepts<br />
The proposed elevated walkway and 550-foot floodwall requires excavation; therefore,<br />
environmental, historic, and archaeological reviews would be required for construction. The<br />
permitting requirements are anticipated to take a significant level <strong>of</strong> review effort. The local<br />
review schedule may take anywhere between 12 and 24 months, and any federal review is<br />
anticipated to take between 12 and 18 months.<br />
Site Plan Approval<br />
Grading associated with the elevated walkway will require approvals from the <strong>City</strong> <strong>of</strong><br />
<strong>Alexandria</strong> and the state <strong>of</strong> Virginia as described below. The following is a summary <strong>of</strong> the<br />
regulatory programs and permits anticipated for the project:<br />
Grading plan approval from TES<br />
<strong>City</strong> <strong>of</strong> <strong>Alexandria</strong> Erosion and Sediment Control Ordinance<br />
VSMP<br />
DCR Construction General Permit<br />
Natural Resources<br />
Preliminary estimates <strong>of</strong> the proposed construction footprint and access requirements show that<br />
impacts would occur both within and adjacent to the <strong>Potomac</strong> River channel and would likely<br />
require more than 1 acre <strong>of</strong> subaqueous bottom impacts within the <strong>Potomac</strong> River below MHW.<br />
The discharge <strong>of</strong> dredge and fill material required for construction <strong>of</strong> the floodwall occurring<br />
channel-ward <strong>of</strong> MHW would require authorization by the USACE Norfolk District, VDEQ, and<br />
VMRC Habitat Management Division. The area landward <strong>of</strong> the <strong>Potomac</strong> River, including the<br />
proposed project area, is located within an RPA and requires authorization from the <strong>City</strong> under<br />
their Environmental Management Ordinance. A NEPA environmental review may be required if<br />
federal funds are used, or if the project includes some federal involvement. The District <strong>of</strong><br />
Columbia should be notified <strong>of</strong> work that may affect the <strong>Potomac</strong> River’s navigable channel.<br />
The following list summarizes the water quality permits that may be required for the proposed<br />
project:<br />
Federal<br />
USACE Clean Water Act IP<br />
Section 10 <strong>of</strong> the Rivers and Harbors Act Permit<br />
State<br />
VMRC Habitat Management Division – Subaqueous bottom and/or tidal wetland impact<br />
authorization<br />
VDEQ Section 401 Certification<br />
VDEQ Water Protection Permit<br />
Virginia Coastal Zone Consistency Determination (VA Coastal Zone Management Program)<br />
28-JUL-10\\ 6-17
Local<br />
Structural <strong>Mitigation</strong> Measure Concepts<br />
Chesapeake Bay Preservation Act Authorization (<strong>City</strong> <strong>of</strong> <strong>Alexandria</strong> Environmental<br />
Management Ordinance)<br />
Should a NEPA decision document be required before construction begins, the process may<br />
require 3 to 12 months to complete. The length <strong>of</strong> time required to develop a NEPA decision<br />
document would be tied to the level <strong>of</strong> environmental documentation determined to be<br />
appropriate, and the respective agency and public involvement processes.<br />
Resource Protection Area (RPA)<br />
The entire elevated walkway is located within the RPA. Therefore, implementation <strong>of</strong> this<br />
project would require authorization under the <strong>City</strong> <strong>of</strong> <strong>Alexandria</strong>’s Environmental Ordinance<br />
(Article XIII). <strong>Flood</strong> control projects are permittable under this ordinance if approved by the<br />
Director <strong>of</strong> TES. Implementation <strong>of</strong> water quality features such as Low Impact Development<br />
measures may be required.<br />
Cultural Resources<br />
Aboveground Resources<br />
The elevated walkway will be considered to have an indirect adverse effect on the physical<br />
setting <strong>of</strong> the historic district or other individual historic properties, which may diminish the<br />
integrity <strong>of</strong> the resources within the viewshed. The scenic viewsheds <strong>of</strong> the waterfront are a<br />
contributing landscape feature to the Old and Historic <strong>Alexandria</strong> District. The floodwall will<br />
reduce or eliminate the scenic viewshed and will have an adverse effect on the historic district.<br />
Archaeological Resources<br />
A Phase I Archaeological Survey (background research and close interval shovel testing at 10<br />
meters/10 yards) would likely be triggered. Moreover, if floodwall construction would impact<br />
the existing bulkheads requiring marine construction, assessment <strong>of</strong> underwater archaeological<br />
resources will be triggered. Because <strong>Alexandria</strong> is a port city <strong>of</strong> great historic significance,<br />
resources at the water’s edge or near shore would also be subject to NHPA Section 106 review,<br />
as it is likely that they would be negatively affected by additional bulk-heading, dredging, or<br />
marine construction activities related to flood barrier construction.<br />
A Phase I Identification study involving background research and shovel testing within the area<br />
<strong>of</strong> direct effect will be required. This could involve a detailed historical study <strong>of</strong> the <strong>Alexandria</strong><br />
waterfront to determine areas <strong>of</strong> previous use and the potential for water-related infrastructure<br />
such as wharfs, cribbing, landings, and docks. Other survey methods may also be necessary such<br />
as a side-scan sonar survey <strong>of</strong> the near-shore areas or underwater documentation and/or<br />
excavation <strong>of</strong> sites that would be disturbed or destroyed by this undertaking. Installation <strong>of</strong><br />
floodwater handing systems such as pumps would also likely trigger Phase I testing before<br />
installation and Archaeological Monitoring during construction.<br />
If archaeological features are identified, a Phase II (Evaluation) follows and if the archaeological<br />
features would be adversely affected by the floodwall construction then Phase III (Treatment)<br />
would be required and would likely involve recordation and data recovery excavations.<br />
28-JUL-10\\ 6-18
6.2.5 BCA and Results<br />
Structural <strong>Mitigation</strong> Measure Concepts<br />
This option provides protection for approximately 43 commercial structures and 23 residential<br />
structures from the nuisance flooding event. Because the design flood elevation for the walkway<br />
is 6.0 feet, the return interval and EAP were calculated for this specific case. The return interval<br />
is 10 years and EAP <strong>of</strong> 0.1. The life <strong>of</strong> the elevated walkway and additional floodwall was<br />
assumed to be approximately 50 years. The elevated walkway would protect approximately 66<br />
structures within three focus areas from the nuisance flood and for up to the 10-year storm. The<br />
elevated walkway would not protect any structures from the intermediate or extreme flood<br />
events. In addition, although it is not included in this planning-level BCA, the elevated walkway<br />
would significantly decrease the number <strong>of</strong> road closures due to flooding. Based on the design<br />
elevation and other data, the total benefit <strong>of</strong> the walkway for the structures is $14,745,000.<br />
An annual maintenance fee <strong>of</strong> 2.5 percent <strong>of</strong> the total cost <strong>of</strong> the elevated walkway and floodwall<br />
was added to the cost <strong>of</strong> the project. The total capital expense <strong>of</strong> the project would be<br />
$5,030,000. The cost for annual maintenance <strong>of</strong> the elevated walkway would be $1,042,000. The<br />
total cost <strong>of</strong> the project used for the BCA, as shown in Table 6-5, is $6,072,000. A more detailed<br />
cost estimate is provided in Appendix G, Exhibit 3.<br />
The BCR for the elevated walkway is 2.43, which indicates that this is a cost-beneficial<br />
mitigation project.<br />
Table 6-5: Elevated Walkway Benefit-Cost Ratio<br />
Total Cost <strong>of</strong> Elevated Walkway $6,072,000<br />
Total Benefit for Walkway $12,14,745<br />
Benefit-Cost Ratio (BCR) for Structures<br />
protected by the <strong>Flood</strong>wall<br />
6.3 JONES POINT BERM<br />
During the extreme flood event (100-year recurrence interval storm), 17 <strong>of</strong> the structures in the<br />
Jones Point focus area are predicted to experience flooding <strong>of</strong> up to 3.35 feet. All <strong>of</strong> the<br />
structures in this area are elevated above the nuisance and intermediate floods; therefore, they<br />
only need protection from the extreme flood event.<br />
6.3.1 Description <strong>of</strong> Alternative<br />
One <strong>of</strong> the alternatives considered for the Jones Point area is construction <strong>of</strong> an earthen berm in<br />
the low area surrounding the affected structures. The berm would be constructed <strong>of</strong> earth with a<br />
clay fill core. Most <strong>of</strong> the interior drainage would be conveyed via new stormdrain pipes.<br />
The conceptual design is to construct a 1,370-linear-foot earthen berm to an elevation <strong>of</strong> 13.2<br />
feet (NAVD88). The elevation provides for 3 feet <strong>of</strong> freeboard from the predicted 100-year<br />
elevation <strong>of</strong> 10.2 (NAVD88). The berm protects the majority <strong>of</strong> the homes (15 <strong>of</strong> the 17 affected<br />
by the extreme flood event) in this area and ties into existing high ground (Figure 6-6).<br />
2.43<br />
28-JUL-10\\ 6-19
CLIENT<br />
PROJ<br />
REVISION NO<br />
SCALE<br />
S ROYAL ST<br />
<strong>City</strong> <strong>of</strong> <strong>Alexandria</strong><br />
S FAIRFAX ST<br />
<strong>Potomac</strong> River <strong>Waterfront</strong> <strong>Flood</strong> <strong>Mitigation</strong> <strong>Study</strong><br />
1 inch = 100 feet<br />
W:\<strong>City</strong> <strong>of</strong> <strong>Alexandria</strong>\15298470 - Lower King St\Task 3\Report<br />
\Final\Figures\MXDs\F6-6 Berm Overall Layout.mxd<br />
0 DES BY<br />
DR BY<br />
CHK BY<br />
CJL<br />
CJL<br />
MER<br />
09/11/09<br />
09/24/09<br />
10/04/09<br />
JEFFERSON ST<br />
GREEN ST<br />
0 25 50 100<br />
LEE CT<br />
Feet<br />
TITLE<br />
FRANKLIN ST<br />
S LEE ST<br />
Proposed Jones Point Berm Layout<br />
200 Orchard Ridge Drive<br />
Gaithersburg, MD 20878<br />
Legend<br />
POTOMAC ST<br />
S UNION ST<br />
Proposed <strong>Flood</strong> Control Berm<br />
Proposed <strong>Flood</strong> Control Berm Area<br />
Proposed Stormdrain<br />
Proposed Inlets<br />
Proposed Pump Stations<br />
<strong>Flood</strong> Effected Structures<br />
Intermediate <strong>Flood</strong><br />
Extreme <strong>Flood</strong><br />
Stormdrain and Sewer<br />
Sanitary, Active<br />
Storm<br />
Combined<br />
CSO<br />
Sanitary, Abandoned<br />
Combined, Abandoned<br />
Storm, Abandoned<br />
Storm, Removed<br />
Buildings<br />
PROJ NO<br />
FIGURE<br />
6-6<br />
15298592
Structural <strong>Mitigation</strong> Measure Concepts<br />
A key consideration in the design <strong>of</strong> the berm is conveyance <strong>of</strong> the interior drainage (i.e., run<strong>of</strong>f<br />
that drains to the berm). The area between South Fairfax Street and South Lee Street and north to<br />
the area between Franklin Street and Jefferson Street drain to the proposed berm (Figure 6-7).<br />
Approximately 6.7 acres drain to the area <strong>of</strong> the proposed berm via two existing stormdrain<br />
systems. During a storm event, storm water run<strong>of</strong>f from this drainage area would pond behind<br />
the berm if adequate storm water diversions were not in place.<br />
Conveyance <strong>of</strong> the interior drainage is proposed in two parts. First, the existing stormdrain<br />
system will be diverted around the berm via construction <strong>of</strong> new inlets at the corners <strong>of</strong> South<br />
Fairfax Street and Green Street and South Lee Street and Green Street. These inlets would be<br />
used to capture overland run<strong>of</strong>f from the approximately a 3.5-acre drainage area north <strong>of</strong> Green<br />
Street and divert it away from the berm (Area 1). Stormdrain pipes would be constructed to<br />
capture run<strong>of</strong>f from the new inlets and the existing stormdrain pipes. The pipes would be sized to<br />
convey the 100-year storm event (31.2 cfs). The concept is for one 36-inch concrete pipe to<br />
convey storm water from each inlet to a 48-inch concrete pipe under Green Street outfalling to<br />
the west <strong>of</strong> the berm.<br />
The second part <strong>of</strong> the interior drainage system is to convey the overland run<strong>of</strong>f that accumulates<br />
within the proposed berm area (e.g., downstream from the proposed stormdrain described<br />
above). Approximately 3.2 acres drain directly to the berm. This run<strong>of</strong>f will be conveyed via two<br />
36-inch concrete culverts through the berm where South Fairfax Street and South Lee Street end<br />
at Jones Point Park (Area 2, Figure 6-7). Flapgates would be installed on these culverts to<br />
prevent backflow into the area during large storm events. In the event that water levels are<br />
elevated on the downstream side <strong>of</strong> the berm due to flooding on the <strong>Potomac</strong> River, a<br />
combination <strong>of</strong> storage and backup pumps will be used to convey the interior drainage in this<br />
area.<br />
As part <strong>of</strong> this project, the existing sanitary sewer systems may need to be relocated. The<br />
relocation <strong>of</strong> the utilities has not been incorporated into the cost estimate, as the project is not<br />
currently cost effective, and relocation would only increase the costs.<br />
Surveyed first floor elevation data show that approximately 1.35 acre-feet <strong>of</strong> storage can be<br />
provided in low areas along the proposed berm without entering the first floor <strong>of</strong> any structures.<br />
Storage for this area was determined using the existing elevation data. During the extreme flood<br />
event on the <strong>Potomac</strong> River, water would need to be pumped out <strong>of</strong> this area during a large storm<br />
event. For the purposes <strong>of</strong> this project, because available storage is limited to 1.35 acre-feet, it<br />
was assumed that pumps would be needed to convey the 100-year discharge. A table showing<br />
stage-storage data is provided in Appendix H.<br />
28-JUL-10\\ 6-21
12 14<br />
8<br />
10<br />
14<br />
CLIENT<br />
PROJ<br />
8<br />
8<br />
REVISION NO<br />
SCALE<br />
16<br />
S ROYAL ST<br />
14<br />
14<br />
10<br />
6<br />
<strong>City</strong> <strong>of</strong> <strong>Alexandria</strong><br />
8<br />
14<br />
12<br />
18<br />
24<br />
16<br />
20<br />
18<br />
4<br />
S FAIRFAX ST<br />
<strong>Potomac</strong> River <strong>Waterfront</strong> <strong>Flood</strong> <strong>Mitigation</strong> <strong>Study</strong><br />
1 inch = 100 feet<br />
W:\<strong>City</strong> <strong>of</strong> <strong>Alexandria</strong>\15298470 - Lower King St\Task 3\Report<br />
\Final\Figures\MXDs\F6-7 Berm Interior Drainage Area.mxd<br />
0 DES BY<br />
DR BY<br />
CHK BY<br />
CJL<br />
CJL<br />
MER<br />
09/11/09<br />
09/24/09<br />
10/04/09<br />
30<br />
1 8<br />
FRANKLIN ST<br />
JEFFERSON ST<br />
GREEN ST<br />
12<br />
LEE CT<br />
0 50 100<br />
25<br />
Feet<br />
6<br />
6<br />
TITLE<br />
6<br />
8<br />
6<br />
30<br />
34<br />
34<br />
4<br />
S LEE ST<br />
4<br />
34<br />
32<br />
Interior Drainage Area for Jones Point Berm<br />
200 Orchard Ridge Drive<br />
Gaithersburg, MD 20878<br />
32<br />
28<br />
Legend<br />
26<br />
22<br />
Proposed <strong>Flood</strong> Control Berm<br />
Proposed <strong>Flood</strong> Control Berm Area<br />
Drainage Area<br />
Area 1 (3.5 ac)<br />
Area 2 (3.2 ac)<br />
Buildings<br />
2ft Contours<br />
8<br />
6<br />
10<br />
8<br />
8<br />
POTOMAC ST<br />
12<br />
S UNION ST<br />
10<br />
PROJ NO<br />
FIGURE<br />
8<br />
8<br />
6-7<br />
4<br />
15298592
6.3.2 Assumptions<br />
Structural <strong>Mitigation</strong> Measure Concepts<br />
For the purposes <strong>of</strong> estimating costs, the geometry <strong>of</strong> the berm is assumed to be as follows:<br />
Average berm height <strong>of</strong> 9 feet<br />
Trapezoidal shape with side slopes <strong>of</strong> 3:1<br />
A bottom width <strong>of</strong> 64 feet<br />
A top width <strong>of</strong> 10 feet<br />
A rectangular clay fill core with a height <strong>of</strong> 5 feet and a width <strong>of</strong> 10 feet<br />
6.3.3 Potential Impacts<br />
The visual and physical obstruction to the view <strong>of</strong> Jones Point Park was considered during the<br />
conceptual design <strong>of</strong> the berm. The visual obstruction would be significant, with an average<br />
berm height <strong>of</strong> 9 feet. Because this is an earthen barrier, however, landscaping would be used to<br />
improve the aesthetics <strong>of</strong> the berm and reduce the visual impact. The physical obstruction is<br />
minimized by the 3:1 slope, specifically where a hiker/biker trail crosses just south <strong>of</strong> Lee Street.<br />
The slope change would also allow maintenance vehicle access from Lee Street if needed.<br />
6.3.4 Permitting/Approval Requirements<br />
The proposed berm requires excavation; and therefore, environmental, historic, and<br />
archaeological permits would be required to construct the berm. The permitting requirements are<br />
anticipated to cause a significant level <strong>of</strong> review effort. The local review schedule may take<br />
between 6 and 12 months. Any federal review is anticipated to take between 9 and 12 months.<br />
Site Plan Approval<br />
Grading associated with the Jones Point berm will require approvals from the <strong>City</strong> <strong>of</strong> <strong>Alexandria</strong><br />
and the state <strong>of</strong> Virginia as described below. The following is a summary <strong>of</strong> the regulatory<br />
programs and permits that are anticipated for the project:<br />
Grading plan approval from Transportation and Environmental Services<br />
<strong>City</strong> <strong>of</strong> <strong>Alexandria</strong> Erosion and Sediment Control Ordinance<br />
Virginia Stormwater Management Program (VSMP)<br />
DCR Construction General Permit<br />
National Park Service Temporary Construction Permit<br />
Natural Resources<br />
The proposed berm would require the removal <strong>of</strong> upland forest vegetation and forested nontidal<br />
wetlands associated with Jones Point Park. Based on preliminary estimates <strong>of</strong> the proposed<br />
construction footprint and access requirements, the project may qualify for the USACE’s State<br />
Program General Permit (SPGP-01). In order to qualify, the project may not cause the loss <strong>of</strong><br />
27-JUL-10\\ 6-23
Structural <strong>Mitigation</strong> Measure Concepts<br />
more than 1 acre <strong>of</strong> nontidal wetlands or 2,000 linear feet <strong>of</strong> streams. Activities causing the loss<br />
<strong>of</strong> more than the aforementioned thresholds will require a Norfolk District USACE IP.<br />
Compensatory mitigation would be required for unavoidable impacts after implementation <strong>of</strong><br />
avoidance and minimization measures during the design process. The District <strong>of</strong> Columbia<br />
should be notified <strong>of</strong> work that may affect the <strong>Potomac</strong> River’s navigable channel.<br />
A summary <strong>of</strong> the water quality permits that may be required for the proposed project is as<br />
follows:<br />
Federal<br />
USACE SPGP-01<br />
State<br />
Virginia Water Protection Permit<br />
Coastal Zone Consistency Determination (MD Coastal Zone Management Program)<br />
Local<br />
Chesapeake Bay Preservation Act Authorization (<strong>City</strong> <strong>of</strong> <strong>Alexandria</strong> Environmental<br />
Management Ordinance)<br />
Both the SPGP-01 joint permit application and local permit acquisition processes, including<br />
identifying suitable compensatory mitigation, are expected to take 4 to 6 months to complete.<br />
Resource Protection Area (RPA)<br />
It appears that the berm is outside <strong>of</strong> the RPA buffer, as it is located over 100 feet away from the<br />
<strong>Potomac</strong> River shoreline. Therefore, authorization under the <strong>City</strong> <strong>of</strong> <strong>Alexandria</strong>’s Environmental<br />
Ordinance (Article XIII) is not anticipated to be required.<br />
Cultural Resources<br />
Aboveground Resources<br />
This alternative may have an indirect adverse effect on the physical setting <strong>of</strong> the historic district<br />
or other individual historic properties which may diminish the integrity <strong>of</strong> the resources within<br />
the viewshed. Any new element introduced into the district that will reduce or eliminate any or<br />
all <strong>of</strong> the scenic viewshed will have an adverse effect on the historic district.<br />
Archaeological Resources<br />
A Phase I Identification study involving background research and shovel testing within the area<br />
<strong>of</strong> direct effect will be required. Installation <strong>of</strong> floodwater handing systems such as pumps would<br />
also likely trigger Phase I testing before installation and Archaeological Monitoring during<br />
construction.<br />
If archaeological features are identified, a Phase II (Evaluation) follows and if the archaeological<br />
features would be adversely affected by the floodwall construction then Phase III (Treatment)<br />
would be required and would likely involve recordation and data recovery excavations.<br />
27-JUL-10\\ 6-24
Structural <strong>Mitigation</strong> Measure Concepts<br />
Additionally, a documented archaeological site (44AX0078) lies directly east <strong>of</strong> the Jones Point<br />
berm area. Previously, as part <strong>of</strong> the Woodrow Wilson Bridge Replacement Project, this site was<br />
been found individually ineligible for listing in the National Register, but was acknowledged to<br />
be a contributing element within the <strong>Alexandria</strong> National Register Historic District by the<br />
Keeper <strong>of</strong> the National Register. However, the Virginia Department <strong>of</strong> Historic Resources Data<br />
Sharing System (VDHR DSS) maps the site as covering the entire Jones Point Park area.<br />
Therefore, any subsurface disturbance in this area would constitute a direct effect to this site.<br />
This would likely trigger Archaeological Monitoring during construction and Phase III<br />
(Treatment) <strong>of</strong> features within the area directly affected.<br />
6.3.5 BCA and Results<br />
The cost <strong>of</strong> the berm is based on construction (materials, labor, and equipment), final design,<br />
permitting, easements, and administrative costs. The total upfront capital expense <strong>of</strong> this project<br />
is approximately $4,083,000. An annual maintenance fee <strong>of</strong> 5 percent <strong>of</strong> the total cost <strong>of</strong> the<br />
berm was added to the cost <strong>of</strong> the project for the BCA. The present cost for the annual<br />
maintenance over the life <strong>of</strong> the berm is about $1,408,000. The total cost <strong>of</strong> the project used in<br />
the BCA would be about $5,492,000, as shown in Table 6-6. A more detailed cost estimate is<br />
provided in Appendix H, Exhibit 1. The total benefits provided by the berm will be $236,400.<br />
The project lifetime is 50 years based on standard USACE and FEMA structural mitigation<br />
design lifetimes.<br />
The BCR for the berm is 0.04, which indicates that this is not a cost-beneficial mitigation<br />
project.<br />
Table 6-6: Berm Benefit-Cost Ratio<br />
Total Cost <strong>of</strong> Berm including construction,<br />
design, and permitting<br />
$5,491,000<br />
Total Benefit for the Berm $236,410<br />
Benefit-Cost Ratio (BCR) for Structures<br />
protected by the Berm<br />
6.4 IMPROVE ROADWAY DRAINAGE<br />
During nuisance flood events, the <strong>City</strong> <strong>of</strong> <strong>Alexandria</strong> encounters flooding between the<br />
intersections <strong>of</strong> King Street and Strand Street, and King Street and North Union Street due<br />
stormdrain catch basin elevations being low, as discussed in Section 3. A proposed solution to<br />
this problem involves raising the intersection <strong>of</strong> King Street and Strand Street as well as raising<br />
stormdrain manholes and catch basins.<br />
6.4.1 Description <strong>of</strong> Alternative<br />
Improving the storm drainage in the area requires several steps. First, the roadway in the vicinity<br />
<strong>of</strong> the intersections <strong>of</strong> King Street and South Union Street, and King Street and Strand Street<br />
would be elevated (Figure 6-8). A section <strong>of</strong> Strand Street would be re-graded to elevation <strong>of</strong><br />
approximately 4 feet. Because the building elevation on the corner <strong>of</strong> King Street and Strand<br />
0.04<br />
27-JUL-10\\ 6-25
Structural <strong>Mitigation</strong> Measure Concepts<br />
Street (i.e., Mai Thai Restaurant) has an FFE <strong>of</strong> below 4 feet (i.e., 3.51 feet), additional drainage<br />
measures would need to be implemented. A trench drain would be installed between Strand<br />
Street and the commercial buildings between King Street and Wales Alley, as well as between<br />
King Street and the Old Dominion Boat Club. These drains would account for stormwater run<strong>of</strong>f<br />
from the elevated portion <strong>of</strong> Strand Street.<br />
As part <strong>of</strong> elevating the road, the elevation <strong>of</strong> the inlets would increase. Manhole and inlet inserts<br />
would be installed at eight inlets in the area <strong>of</strong> the proposed storm drainage improvements. The<br />
minimum rim inlet would be at an elevation <strong>of</strong> 3.25 feet as compared to 2.0 feet.<br />
6.4.2 Assumptions<br />
Several factors limit how much the road and inlets can be elevated. Three commercial buildings<br />
adjacent to the proposed road and inlet improvements have FFEs below an elevation <strong>of</strong> 4 feet.<br />
The grading for this alternative considered the assumed curb height <strong>of</strong> 6 inches (although from<br />
site visits and photographs, the existing curb was observed to be less than 6 inches), and used the<br />
maximum sidewalk slope from the Americans with Disabilities Act (ADA) <strong>of</strong> 2 percent.<br />
Considering these items, the highest proposed inlet elevation would be approximately 3.2 feet.<br />
The inlets that would have the greatest increase in elevation are located on the southwest corner<br />
<strong>of</strong> King Street and South Union Street with the rim being elevated to 3.5 feet from 2.0 feet.<br />
This alternative specifically addressed the road and inlet elevation actions. However, this<br />
alternative could be enhanced by internally elevating the first floor <strong>of</strong> the businesses with first<br />
floor elevations below 4 feet in the area. Providing slight internal elevation <strong>of</strong> the structures (i.e.,<br />
0.5 foot) would allow the modified storm drain inlet rim elevations to be closer to 4 feet, which<br />
would provide greater flood mitigation for the nuisance flooding event. Internal elevation <strong>of</strong><br />
structures were not included in the cost <strong>of</strong> this alternative, as this measure would be implemented<br />
independently by private property owners.<br />
6.4.3 Potential Impacts<br />
During construction, temporary impacts to the roads and utilities will occur in the project area.<br />
Construction impacts include temporary road and sidewalk closures. In addition to the<br />
stormdrain and road elevation work, curbs and gutters along King Street, South Union Street and<br />
The Strand will be reconstructed, including any curb cuts. Furthermore, the brick sidewalks in<br />
this area will be reset after the re-grading <strong>of</strong> the roadway and curbs and gutters.<br />
Once construction is completed, permanent potential impacts as a result <strong>of</strong> implementation <strong>of</strong><br />
this alternative are minor.<br />
27-JUL-10\\ 6-26
CLIENT<br />
PROJ<br />
REVISION NO<br />
SCALE<br />
WALES AL<br />
Ex:2.31 Pr:3.25<br />
Ex:2.71 Pr:3.5<br />
Ex:3.07 Pr:3.5<br />
Ex:3.17 Pr:3.5<br />
Ex:2.1 Pr:3.25<br />
Ex:3.16 Pr:3.25<br />
Ex:2.73 Pr:3.2<br />
S UNION ST<br />
<strong>City</strong> <strong>of</strong> <strong>Alexandria</strong><br />
N UNION ST<br />
10<br />
<strong>Potomac</strong> River <strong>Waterfront</strong> <strong>Flood</strong> <strong>Mitigation</strong> <strong>Study</strong><br />
1 inch = 30 feet<br />
W:\<strong>City</strong> <strong>of</strong> <strong>Alexandria</strong>\15298470 - Lower King St\Task 3\Report<br />
\Final\Figures\MXDs\F6-8 Road Improvements.mxd<br />
0 DES BY<br />
DR BY<br />
CHK BY<br />
CJL<br />
CJL<br />
MER<br />
09/11/09<br />
09/25/09<br />
10/04/09<br />
8<br />
KING ST<br />
6<br />
WALES AL<br />
0 15 30<br />
7.5<br />
Feet<br />
4<br />
TITLE<br />
2<br />
4<br />
Legend<br />
STRAND ST<br />
4<br />
Ex:2 Pr:3.5<br />
4<br />
Proposed Roadway Drainage Improvements Layout<br />
200 Orchard Ridge Drive<br />
Gaithersburg, MD 20878<br />
Proposed Trench Drain<br />
Manholes to be Improved<br />
6<br />
2<br />
Ex: Existing Rim Elevation (feet)<br />
Catch Basins to be Improved Pr: Proposed Rim Elevation (feet)<br />
Proposed Grading, 4 ft<br />
Existing 2 Feet Contours<br />
Proposed Road Re-grading<br />
Building with First Floor Elev<br />
PROJ NO<br />
FIGURE<br />
6-8<br />
15298592
6.4.4 Permitting/Approval Requirements<br />
Structural <strong>Mitigation</strong> Measure Concepts<br />
Implementation <strong>of</strong> this project would require grading and environmental permits due to ground<br />
disturbance. The permitting requirements are anticipated to cause a moderate level <strong>of</strong> review<br />
effort. The local review schedule may take between 6 and 12 months, and any federal review is<br />
anticipated to take between 9 and 12 months.<br />
Site Plan Approval<br />
Grading associated with the roadway improvements will require approvals from the <strong>City</strong> <strong>of</strong><br />
<strong>Alexandria</strong> and the state <strong>of</strong> Virginia as described below. The following is a summary <strong>of</strong> the<br />
regulatory programs and permits anticipated for the project:<br />
Grading plan approval from TES<br />
<strong>City</strong> <strong>of</strong> <strong>Alexandria</strong> Erosion and Sediment Control Ordinance<br />
VSMP<br />
DCR Construction General Permit<br />
Natural Resources<br />
Grading associated with road improvements and sidewalk alterations, which are proposed to<br />
involve approximately 40,000 square feet, will require approvals from the <strong>City</strong> <strong>of</strong> <strong>Alexandria</strong><br />
and potentially the State programs summarized below. The need for approvals will depend upon<br />
the scope <strong>of</strong> the ultimate design, project location, and area <strong>of</strong> disturbance. The following is a<br />
summary <strong>of</strong> the regulatory programs and permits that are currently anticipated for the project:<br />
Chesapeake Bay Preservation Act<br />
<strong>City</strong> <strong>of</strong> <strong>Alexandria</strong> Environmental Management Ordinance<br />
<strong>City</strong> <strong>of</strong> <strong>Alexandria</strong> Erosion and Sediment Control Ordinance<br />
Virginia Stormwater Management Program<br />
Department <strong>of</strong> Conservation and Recreation Construction General Permit<br />
Resource Protection Area (RPA)<br />
The roadway improvement project appears to be outside <strong>of</strong> the RPA buffer, as it is located over<br />
100 feet away from the <strong>Potomac</strong> River shoreline. Therefore, authorization under the <strong>City</strong> <strong>of</strong><br />
<strong>Alexandria</strong>’s Environmental Ordinance (Article XIII) is not anticipated to be required.<br />
Cultural Resources<br />
Aboveground Resources<br />
The roadways and associated features in the Old and Historic <strong>Alexandria</strong> Historic District are<br />
historically significant elements within the district. Features <strong>of</strong> the roadways or associated with<br />
roadways that may, depending upon their period <strong>of</strong> origin and current condition, contribute to<br />
28-JUL-10\\ 6-28
Structural <strong>Mitigation</strong> Measure Concepts<br />
this historical significance include: their alignment (grid pattern); width; paving materials<br />
(cobblestone, brick, asphalt, concrete); embedded streetcar/railroad tracks; curbing (granite,<br />
brick, brick asphalt, concrete, iron, steel); sidewalks (flagstone, brick, asphalt, concrete); bridges;<br />
railings; culverts and other drainage infrastructure; signage; traffic and street lighting; other<br />
character-defining hardscape features; landscape features (trees). If any <strong>of</strong> these historically<br />
significant features are altered in the elevation <strong>of</strong> the roadway, then this could adversely affect<br />
the features, and the historic district in general. Additionally, depending upon the nature <strong>of</strong> the<br />
work, adjacent historic properties, such as buildings (residences and business) and structures<br />
(retaining walls), objects (fences, bollards), and sites (archaeological, discussed below, landscape<br />
elements) may be adversely affected.<br />
The exact scope <strong>of</strong> work and project location would need to be reviewed for a final<br />
determination. In some cases, the work may be undertaken in such a manner as to avoid or<br />
minimize adverse effects. For example, if historic materials are removed and replaced in their<br />
original location and configuration, only elevated by a few inches – such as brick paving on a<br />
sidewalk – this may avoid adverse effects. If historic features are left in place but obscured by<br />
new infrastructure such as paving or sidewalks laid on top <strong>of</strong> the historic features, this may be an<br />
adverse effect. Similarly, if elevation <strong>of</strong> sidewalks occurs directly abutting historic buildings or<br />
structures, this may damage or obscure character-defining features <strong>of</strong> the historic properties such<br />
as decorative features, doorways and thresholds, basement windows.<br />
Archaeological Resources<br />
If this alternative requires no subsurface disturbance (i.e., blacktop applied directly to existing<br />
surfaces), no archaeological testing would be required and no adverse effects to archaeological<br />
resources would be anticipated. Archaeological survey would likely be triggered by alterations to<br />
streets within the historic district if subsurface disturbance is involved, as these actions may<br />
result in adverse effects to archaeological resources. Construction preparation activities such as<br />
road milling may expose historic brick or “cobblestone” streets that are common in port settings<br />
such as <strong>Alexandria</strong>. Moreover, older roadbeds and previous street alignments may also be<br />
encountered and/or disturbed by road elevation. This alternative would likely trigger a Phase I<br />
Identification study involving background research and shovel testing within the area <strong>of</strong> direct<br />
effect and Archaeological Monitoring during construction.<br />
6.4.5 BCA and Results<br />
A BCA was not performed for this mitigation alternative due to the benefits being difficult to<br />
quantify. The primary impact <strong>of</strong> these less than nuisance floods are road closures and reduced<br />
access to the business in the affected area. The proposed project would reduce the frequency <strong>of</strong><br />
these events, and therefore reduce road closures along eastern King Street and The Strand, and<br />
allow greater access to the adjacent business. The reduction in flooding frequency was estimated<br />
based on the USGS gage for the <strong>Potomac</strong> River at Cameron Street. Tidal elevations were<br />
reviewed over a 1-year period from September 2008 to September 2009. A graph <strong>of</strong> this data is<br />
shown in Appendix I. The water level elevation <strong>of</strong> 2 feet was exceeded 186 times. During the<br />
same period, the water level elevation <strong>of</strong> 3.2 feet was exceeded 10 times. Increasing the<br />
minimum inlet rim elevation from 2.0 feet to 3.2 feet would considerably reduce the flooding<br />
frequency.<br />
28-JUL-10\\ 6-29
Structural <strong>Mitigation</strong> Measure Concepts<br />
The overall project cost would be $565,700, based on the construction, design, permitting, and<br />
administrative costs (e.g., road detours during construction). No additional maintenance other<br />
than what the <strong>City</strong> currently provides would be required as a result <strong>of</strong> the implementation <strong>of</strong> this<br />
project. A more detailed cost estimate for this project is provided in Appendix I.<br />
6.5 ACQUIRE PROPERTIES<br />
Acquisition is the only mitigation measure that truly eliminates risk, because a property is<br />
physically removed from the floodplain. This section presents the methodology for the<br />
acquisition assessment including the assumptions, the potential impacts <strong>of</strong> this alternative, and<br />
the associated permit requirements. The BCA for each individual focus area is in Section 6.5.4.<br />
The methodology for calculating total benefit values and the total costs are presented in<br />
Section 5.<br />
6.5.1 Assumptions<br />
Based on the following assumptions, row houses were considered for acquisition if the entire<br />
row <strong>of</strong> houses was affected by flooding:<br />
Within a series <strong>of</strong> row houses, one unit (property) cannot be structurally separated without<br />
causing significant structural changes to the adjacent units,<br />
Property owners not affected by flooding are extremely resistant to relocating, and<br />
The <strong>City</strong> does not wish to pursue acquisition through eminent domain; only willing residents<br />
will participate.<br />
6.5.2 Potential Impacts<br />
Property acquisition will impact the community in numerous ways. One impact <strong>of</strong> property<br />
acquisition is the effect it has on property values and taxes. Community acquisition <strong>of</strong> privately<br />
owned properties reduces the tax base, which can affect the community’s ability to maintain<br />
existing services. In addition, demolishing residential properties reduces the housing inventory<br />
and demolishing commercial properties reduces the commercial services provided in an area.<br />
In the case <strong>of</strong> this study area, valuable historic buildings would be lost and the character <strong>of</strong> Old<br />
Towne would be changed by removing historic structures. All <strong>of</strong> these impacts must be<br />
considered to ensure that the community can protect itself from flood hazards, while<br />
concurrently maintaining its financial stability, ability to provide services, and preserving<br />
historic sites.<br />
6.5.3 Permitting/Approval Requirements<br />
Dependent upon the historic value <strong>of</strong> the building selected for acquisition/demolition, the<br />
permitting requirements are anticipated to cause a significant level <strong>of</strong> review effort. The local<br />
review schedule may take 9 to 12 months, and any federal review is anticipated to take between<br />
9 and 18 months.<br />
28-JUL-10\\ 6-30
Site Plan Approval<br />
Structural <strong>Mitigation</strong> Measure Concepts<br />
For projects less than 2,500 square feet, grading plan approval is not required. It is anticipated<br />
that for single structure acquisition projects, grading plan approval would not be required.<br />
However for large structures, such as a row <strong>of</strong> townhouses, it is likely that a grading plan<br />
showing the demolition details would be required to be submitted to the <strong>City</strong>’s TES group. Other<br />
site plan permits/approvals are not anticipated for acquisition activities.<br />
Natural Resources<br />
This alternative creates no anticipated natural resource impacts. However, if soil disturbance is<br />
required or a structure to be demolished is within a RPA or a wetland, a permit review should be<br />
performed.<br />
Cultural Resources<br />
Aboveground Resources<br />
The demolition <strong>of</strong> a structure may have direct or indirect effects if the undertaking is to occur to<br />
an historic structure or within or next to an historic district. However, each building will have to<br />
be reviewed independently. This alternative could result in a cumulative adverse effect on the<br />
physical setting and character <strong>of</strong> the historic district as a whole. With each building that is<br />
removed or demolished, the overall integrity <strong>of</strong> the historic district is further diminished to the<br />
point where the area may no longer meet the criteria to be eligible as an historic district.<br />
Archaeological Resources<br />
A Phase I Archaeological Survey (background research and close interval shovel testing at 10meter/10-yard<br />
intervals) would likely be triggered by building demolition, as this would involve<br />
subsurface disturbance.<br />
6.5.4 Applicability <strong>of</strong> Acquisition/Benefit-Cost Analysis<br />
This section defines the applicability <strong>of</strong> acquisition, describes structures included in the BCA for<br />
acquisition in each <strong>of</strong> the four focus areas (Jones Point, King Street, <strong>Waterfront</strong> Commercial, and<br />
North Union), and presents the benefits, costs, and resultant BCR. Appendix J contains support<br />
data for these analyses.<br />
Jones Point<br />
For the Jones Point focus area, all <strong>of</strong> the houses in the flood prone areas are residential row<br />
houses with the exception <strong>of</strong> two free-standing residential properties on South Lee Street. Only<br />
the extreme flood event causes flood damages to the properties. Based on the assumptions listed<br />
in Section 6.5.1, 13 properties are feasible for acquisition. The estimated financial benefit for<br />
acquisition <strong>of</strong> these 13 properties is $198,000.<br />
The total estimated cost FMV <strong>of</strong> land and buildings in the Jones Point Focus Area is<br />
$10,951,000. The BCA for the Jones Point focus area is presented in Table 6-7, resulting in a<br />
BCR <strong>of</strong> 0.02. This BCA indicates that property acquisition in Jones Point would not be costeffective<br />
because the costs substantially outweigh the benefits.<br />
28-JUL-10\\ 6-31
King Street<br />
Structural <strong>Mitigation</strong> Measure Concepts<br />
Table 6-7: Acquisition for Jones Point Benefit-Cost Results<br />
Total Cost (FMV) <strong>of</strong> Land + Building $10,951,000<br />
Other Costs $329,000<br />
Total Costs $11,280,000<br />
Total Benefit for Acquisition $198,000<br />
Benefit-Cost Ratio (BCR) 0.02<br />
The King Street focus area is a commercial area predominantly composed <strong>of</strong> shops, restaurants,<br />
and boutiques with some row houses. In the King Street focus area, 23 commercial and five<br />
residential structures are prone to flooding. One residential unit was excluded from this analysis;<br />
the unit excluded is attached to a separate row <strong>of</strong> houses that is not susceptible to flooding. The<br />
estimated financial benefit for acquisition <strong>of</strong> these 28 properties is $4,230,000.<br />
The total estimated cost FMV <strong>of</strong> land and buildings in the King Street focus area is $85,320,000.<br />
The total other costs for residential and commercial properties were an estimated $5,507,000.<br />
The BCA for the King Street focus area is presented in Table 6-8, resulting in a BCR <strong>of</strong> 0.05.<br />
This BCA indicates that property acquisition in King Street would not be cost effective, because<br />
the costs outweigh the benefits.<br />
<strong>Waterfront</strong> Commercial<br />
Table 6-8: Acquisition for King Street Benefit-Cost Results<br />
Total Cost (FMV) <strong>of</strong> Land + Building $85,320,000<br />
Other Costs $5,507,000<br />
Total Costs $90,872,000<br />
Total Benefit for Acquisition $4,230,000<br />
Benefit-Cost Ratio (BCR) 0.05<br />
The <strong>Waterfront</strong> Commercial focus area is composed <strong>of</strong> various commercial buildings including<br />
warehouses, parking garages, shops, an <strong>of</strong>fice complex, and a gallery. Based on the assumptions<br />
outlined in Section 6.5.1, our benefit calculations consider only four properties during the<br />
intermediate flood event and 28 properties during the extreme event. The estimated financial<br />
benefit for acquisition <strong>of</strong> these properties is $7,336,000.<br />
The total estimated cost FMV <strong>of</strong> land and buildings in the <strong>Waterfront</strong> Commercial focus area is<br />
$99,000,000. Because <strong>of</strong> the variance in average building square footage price, the FMV was<br />
determined for each <strong>of</strong> the 22 commercial properties. The total other costs were an estimated<br />
$5,375,000<br />
The BCA for the <strong>Waterfront</strong> Commercial focus area is presented in Table 6-9, resulting in a<br />
BCR <strong>of</strong> 0.07. This BCA indicates that property acquisition in <strong>Waterfront</strong> Commercial would not<br />
be cost-effective because the costs substantially outweigh the benefits.<br />
28-JUL-10\\ 6-32
North Union<br />
Structural <strong>Mitigation</strong> Measure Concepts<br />
Table 6-9: Acquisition for <strong>Waterfront</strong> Commercial Benefit-Cost Results<br />
Total Cost (FMV) <strong>of</strong> Land + Building $99,000,000<br />
Other Costs $5,375,000<br />
Total Costs $104,375,000<br />
Total Benefit for Acquisition $7,336,000<br />
Benefit-Cost Ratio (BCR) 0.07<br />
The North Union focus area is a residential community containing only residential row houses.<br />
Thirty-four residential properties were considered feasible for acquisition. The estimated<br />
financial benefit for acquisition <strong>of</strong> these 34 properties is $610,000.<br />
The total estimated cost FMV <strong>of</strong> land and buildings in the North Union focus area is<br />
$18,500,000. The total other costs were an estimated $1,360,000.<br />
The BCA for the North Union focus area is presented in Table 6-10, resulting in a BCR <strong>of</strong> 0.03.<br />
This BCA indicates that property acquisition in North Union would not be cost-effective because<br />
the costs substantially outweigh the benefits.<br />
6.6 FLOODPROOFING<br />
Table 6-10: Acquisition for North Union Benefit-Cost Results<br />
Total Cost (FMV) <strong>of</strong> Land + Building $18,500,000<br />
Other Costs for North Union $1,360,000<br />
Total Costs $19,860,000<br />
Total Benefit for Acquisition $610,000<br />
Benefit-Cost Ratio (BCR) 0.03<br />
<strong>Flood</strong>pro<strong>of</strong>ing provides a variety <strong>of</strong> methods to protect structures from flood waters. As<br />
described in Section 3.1.3, dry floodpro<strong>of</strong>ing was selected as the mitigation measure to be<br />
assessed further. This section presents the analysis <strong>of</strong> the dry floodpro<strong>of</strong>ing assessment including<br />
the assumptions, the potential impacts imposed by this alternative, and the associated permit<br />
requirements.<br />
6.6.1 Assumptions<br />
The following assumptions were used to assess floodpro<strong>of</strong>ing as a mitigation measure for the<br />
four focus areas.<br />
Only dry floodpro<strong>of</strong>ing measures were considered.<br />
<strong>Flood</strong>pro<strong>of</strong> membranes and window shields were not included due to the historic nature <strong>of</strong><br />
the area.<br />
28-JUL-10\\ 6-33
Structural <strong>Mitigation</strong> Measure Concepts<br />
Not all structures were evaluated for construction elements, such as height <strong>of</strong> windows, size<br />
<strong>of</strong> doorways, materials used, or the presence <strong>of</strong> basements.<br />
6.6.2 Potential Impacts<br />
<strong>Flood</strong>pro<strong>of</strong>ing has several potential impacts. Positive impacts include protection <strong>of</strong> structures<br />
and contents from flood damages and improving the communities standing in FEMA’s CRS. As<br />
discussed in Section 3, the historic structures in <strong>Alexandria</strong> present significant limitations to the<br />
selection <strong>of</strong> some floodpro<strong>of</strong>ing options. Elements such as floodpro<strong>of</strong> doors and windows use<br />
materials that are not historically accurate. More discussion related to the historic effects is<br />
contained in the permit review below.<br />
6.6.3 Permitting/Approval Requirements<br />
Dependent upon the floodpro<strong>of</strong>ing alternatives selected by the property owner, the permitting<br />
requirements for floodpro<strong>of</strong>ing are only anticipated to cause a moderate level <strong>of</strong> review effort.<br />
Given the historic sensitivity, the local review schedule could take between 4 and 12 months, and<br />
any federal review is anticipated to take 12 to 24 months.<br />
Site Plan Approval<br />
Site plan preparation and grading plan approval not is likely to be required for any floodpro<strong>of</strong>ing<br />
project. However, for patio improvements, if the area <strong>of</strong> disturbance is greater than 2,500 square<br />
feet, a grading plan will be required to be submitted to the <strong>City</strong>’s TES group. Other site plan<br />
permits/approvals are not anticipated for floodpro<strong>of</strong>ing activities.<br />
Natural Resources<br />
This alternative creates no anticipated natural resource impacts. However, if soil disturbance is<br />
required, a permit review should be performed.<br />
Cultural Resources<br />
Aboveground Resources<br />
Each building requires independent review with an exact scope <strong>of</strong> work to assess the impacts <strong>of</strong><br />
the specific floodpro<strong>of</strong>ing measures proposed for that building. Typically, exterior alterations<br />
that replace original fabric and design may adversely affect the look <strong>of</strong> the building. This can be<br />
interpreted to result in a cumulative adverse effect on the physical setting and character <strong>of</strong> the<br />
historic district as a whole. As the historic fabric and integrity <strong>of</strong> multiple buildings are altered<br />
and replaced with historically uncharacteristic materials, the overall integrity <strong>of</strong> the historic<br />
district is diminished.<br />
Archaeological Resources<br />
An archaeological survey would likely not be triggered by this alternative. However, if the<br />
process requires access to the area around the foundations or basements <strong>of</strong> historic structures,<br />
this could trigger a Phase I Identification focus (background research and shovel testing <strong>of</strong> the<br />
area <strong>of</strong> direct effect). If archaeological features were identified as a result <strong>of</strong> this focus, then a<br />
28-JUL-10\\ 6-34
Structural <strong>Mitigation</strong> Measure Concepts<br />
Phase II (National Register Evaluation) focus would follow. If the archaeological features were<br />
found eligible for listing in the National Register and would be adversely affected by<br />
floodpro<strong>of</strong>ing, then Phase III (Treatment) would be required and would likely involve<br />
recordation and data recovery excavations. Since membranes and window shields are not<br />
proposed, this review process is unlikely to be required for any <strong>of</strong> the floodpro<strong>of</strong>ing<br />
recommendations<br />
6.6.4 <strong>Flood</strong>pro<strong>of</strong>ing Applicability/Benefit-Cost Analysis<br />
This section defines the solutions included in the BCA for floodpro<strong>of</strong>ing in each <strong>of</strong> the four<br />
focus areas (Jones Point, King Street, <strong>Waterfront</strong> Commercial, and North Union) and presents<br />
the benefits, costs, and resultant BCR. Note that the King Street Focus Area discussion was<br />
separated into commercial and residential areas. For purposes <strong>of</strong> the BCA, it was assumed that<br />
any structure susceptible to the nuisance, intermediate or extreme flood event would need a<br />
floodpro<strong>of</strong> option. Secondary glazing <strong>of</strong> windows and window shields are less expensive than<br />
replacement windows, and flood gates are less expensive than custom doors. However, given the<br />
historic nature <strong>of</strong> the study area and the variety <strong>of</strong> construction styles, cost estimates were<br />
inflated to allow for the cost variations seen in custom construction. The costs used to determine<br />
BCR for each focus area are shown in Table 6-11. The method for computing the cost for each<br />
floodpro<strong>of</strong>ing method is described in Appendix K.<br />
Table 6-11: Estimated Costs for Various <strong>Flood</strong>pro<strong>of</strong>ing Methods<br />
Method Cost/Structure<br />
<strong>Flood</strong> Gate $900<br />
Custom <strong>Flood</strong>pro<strong>of</strong> Door $10,000<br />
Custom <strong>Flood</strong>pro<strong>of</strong> Window (residential) $3,000<br />
Custom <strong>Flood</strong>pro<strong>of</strong> Window (commercial) $6,000<br />
Raise Patio/Fill $8,000<br />
Internal Elevation Based on Average Square Footage Per Focus Area<br />
Where floodpro<strong>of</strong> doors are practical, they are considered. <strong>Flood</strong> gates are indicated where a<br />
door is not practical. <strong>Flood</strong> gates could be used in place <strong>of</strong> floodpro<strong>of</strong> doors throughout, but they<br />
are an active system and not as aesthetically appealing. The cost estimate for windows assumes<br />
replacement windows with suitable historic features. A less expensive flood barrier could be<br />
used for the window, but that would require placement <strong>of</strong> a product before the flood event<br />
occurs, and is not as aesthetically acceptable.<br />
Jones Point<br />
Approximately 17 structures in the Jones Point focus area are at risk <strong>of</strong> flooding from the<br />
extreme flood event. All <strong>of</strong> these buildings are residential. In some cases, field reconnaissance<br />
provided limited access because residents were not home.<br />
Table 6-12 shows the different dry floodpro<strong>of</strong>ing options and the approximate number <strong>of</strong><br />
structures within the Jones Point focus area that might benefit from each. Approximately 15<br />
structures could potentially benefit from a floodpro<strong>of</strong> gate or door. Eight structures have<br />
28-JUL-10\\ 6-35
Structural <strong>Mitigation</strong> Measure Concepts<br />
windows that require protection. In addition, eight structures may benefit from raising the ground<br />
elevation at the point <strong>of</strong> floodwater entry. The recommended floodpro<strong>of</strong>ing measure for each<br />
structure in the Jones Point focus area, as well as the level <strong>of</strong> protection it would provide, is<br />
shown on Figure 6-9.<br />
Table 6-12: <strong>Flood</strong>pro<strong>of</strong>ing Options for Jones Point: 17 Residential Structures<br />
Method Cost / Structure Number <strong>of</strong> Structures<br />
<strong>Flood</strong> Gate $900 15<br />
<strong>Flood</strong>pro<strong>of</strong> Openings<br />
Door $10,000 14<br />
Window $3,000 8<br />
Raise Patio/Fill $8,000 8<br />
For purposes <strong>of</strong> determining the benefit cost ratio, the most expensive dry floodpro<strong>of</strong>ing plan for<br />
Jones Point was considered. The most expensive floodpro<strong>of</strong>ing option considered is replacing all<br />
doors and windows that are below the flood elevation with floodpro<strong>of</strong> doors and windows.<br />
As shown in Table 6-13, the floodpro<strong>of</strong>ing BCA results in a BCR <strong>of</strong> 1.0. Because the most<br />
expensive floodpro<strong>of</strong>ing scenario is cost effective, any combination <strong>of</strong> dry floodpro<strong>of</strong>ing<br />
techniques used in the Jones Point focus area will also be cost effective.<br />
Table 6-13: Cost Ratio for Jones Point: 17 Residential Structures<br />
Method Cost/Structure # Structures Units/Structure Total Cost<br />
<strong>Flood</strong> Gate $900 3 1.5 $4,000<br />
<strong>Flood</strong>pro<strong>of</strong> Openings<br />
Door $10,000 14 1.5 $210,000<br />
Window $3,000 8 1 $24,000<br />
Total Cost = $238,000<br />
Total Benefit = $231,000<br />
BCR = 1.0<br />
King Street Commercial<br />
Approximately 29 structures within the King Street focus area are predicted to flood from the<br />
extreme flood event. Of these 29 structures, 23 are commercial structures. About 13 <strong>of</strong> these<br />
structures experience extreme flood depths greater than 3 feet. Therefore, dry floodpro<strong>of</strong>ing will<br />
not protect these structures from the extreme flood event. However, the depth <strong>of</strong> flooding from<br />
the intermediate flood event is less than 3 feet for all 23 commercial structures.<br />
Table 6-14 shows the different dry floodpro<strong>of</strong>ing options and the approximate number <strong>of</strong><br />
commercial structures within the King Street focus area that might benefit from each. It is<br />
estimated that all 23 structures could benefit from floodpro<strong>of</strong> doors and windows. Most <strong>of</strong> the<br />
structures could make use <strong>of</strong> a flood gate, but floodpro<strong>of</strong> doors are recommended instead <strong>of</strong><br />
floodgates for commercial properties because they are a passive system <strong>of</strong> flood protections.<br />
28-JUL-10\\ 6-36
CLIENT<br />
PROJ<br />
REVISION NO<br />
SCALE<br />
S ROYAL ST<br />
<strong>City</strong> <strong>of</strong> <strong>Alexandria</strong><br />
JEFFERSON ST<br />
Jones Point<br />
<strong>Potomac</strong> River <strong>Waterfront</strong> <strong>Flood</strong> <strong>Mitigation</strong> <strong>Study</strong><br />
1 inch = 100 feet<br />
W:\<strong>City</strong> <strong>of</strong> <strong>Alexandria</strong>\15298470 - Lower King St\Task 3\Report<br />
\Final\Figures\MXDs\F6-9 Jones_Point_Area.mxd<br />
0 DES BY<br />
DR BY<br />
CHK BY<br />
JEA<br />
JEA<br />
MER<br />
09/22/09<br />
09/24/09<br />
10/04/09<br />
0 25 50 100<br />
S FAIRFAX ST<br />
Feet<br />
TITLE<br />
GREEN ST<br />
LEE CT<br />
Legend<br />
Focus Area<br />
FRANKLIN ST<br />
S LEE ST<br />
Jones Point Focus Area <strong>Flood</strong>pro<strong>of</strong>ing Options<br />
200 Orchard Ridge Drive<br />
Gaithersburg, MD 20878<br />
<strong>Flood</strong>pro<strong>of</strong> Openings to Protect from Extreme <strong>Flood</strong><br />
Raise LAG to Protect from Extreme <strong>Flood</strong><br />
Above Extreme <strong>Flood</strong><br />
Outside Focus Area<br />
PROJ NO<br />
FIGURE<br />
6-9<br />
15298592
Structural <strong>Mitigation</strong> Measure Concepts<br />
There are approximately eight commercial structures within this focus area where internal<br />
elevation appears to be feasible. These include the following: 100 King Street, Windsor Studio,<br />
Ben & Jerry’s, Firehook Bakery, Art Craft, Old Town Trading Post, The Small Mall, and<br />
Christmas Attic.<br />
For those structures where internal elevation is not feasible, floodpro<strong>of</strong>ing <strong>of</strong> the doors and<br />
windows is recommended. The commercial structures in the King Street focus area typically<br />
have two doors and two or three windows that need flood protection.<br />
Table 6-14: <strong>Flood</strong>pro<strong>of</strong>ing Options for King Street: 23 Commercial Structures<br />
Method Cost/Structure Structures for Benefits<br />
<strong>Flood</strong> Gate $900 23<br />
<strong>Flood</strong>pro<strong>of</strong> Openings<br />
Door $10,000 23<br />
Window $6,000 23<br />
Internal Elevation $105,000 8<br />
Internal elevation is recommended for eight properties. The remaining 15 properties are<br />
estimated with floodpro<strong>of</strong> doors and windows. Although dry floodpro<strong>of</strong>ing is generally<br />
recommended for up to a depth <strong>of</strong> 3 feet <strong>of</strong> flooding, it is usually not possible to internally<br />
elevate a structure 3 feet. The height <strong>of</strong> the ceiling will limit how far the floor can be raised.<br />
Therefore, the recommendation assumes that internal elevation can raise the first floor elevation<br />
by 1 foot. The recommended floodpro<strong>of</strong>ing measure for each structure in the King Street focus<br />
area, as well as the level <strong>of</strong> protection it would provide, is shown on Figure 6-10. It is important<br />
to note that floodpro<strong>of</strong>ing <strong>of</strong> the doors and windows can be used instead <strong>of</strong> internal elevation and<br />
could provide up to 2 more feet <strong>of</strong> protection in conjunction with internal elevation. However,<br />
internal elevation is more reliable because it does not require maintenance.<br />
As shown in Table 6-15, the floodpro<strong>of</strong>ing BCA results in a BCR <strong>of</strong> 4.7. Because the most<br />
expensive floodpro<strong>of</strong>ing scenario is cost effective, any combination <strong>of</strong> dry floodpro<strong>of</strong>ing<br />
techniques used in the commercial structures in the King Street focus area will also be cost<br />
effective.<br />
Table 6-15: Benefit Cost Ratio for King Street: 23 Commercial Structures<br />
Method Cost/Structure # Structures Units/Structure Total Cost<br />
<strong>Flood</strong>pro<strong>of</strong> Openings<br />
Door $10,000 15 2 $300,000<br />
Window $6,000 15 2.5 $225,000<br />
Internal Elevation $105,000 8 1 $837,000<br />
Total Cost = $1,362,000<br />
Total Benefit = $6,337,000<br />
BCR = 4.7<br />
28-JUL-10\\ 6-38
King Street Residential<br />
Structural <strong>Mitigation</strong> Measure Concepts<br />
Of the 29 structures within the King Street focus area described above, six are residential. These<br />
are along Prince Street, near the intersection with South Union Street. Only one <strong>of</strong> these, 100<br />
Prince Street, has an extreme flood depth greater than 3 feet. Therefore, all the rest can be<br />
floodpro<strong>of</strong>ed to protect from the extreme storm.<br />
Table 6-16 below shows the different dry floodpro<strong>of</strong>ing options and the approximate number <strong>of</strong><br />
residential structures within the King Street focus area that might benefit from each. For<br />
example, approximately two structures could benefit from raising the lowest adjacent grade,<br />
which is estimated to cost about $8,000 per building. Our topography indicates that these<br />
structures may be at risk <strong>of</strong> flooding from the back <strong>of</strong> the buildings. However, our field<br />
reconnaissance team did not have access to the back <strong>of</strong> these buildings to determine if there are<br />
any points <strong>of</strong> entry there. It is assumed that placing fill to raise a back patio may be an option for<br />
some <strong>of</strong> the structures.<br />
Two <strong>of</strong> these structures had low front windows that would need floodpro<strong>of</strong>ing. The other four<br />
structures would only need the doors floodpro<strong>of</strong>ed. Also, it was assumed that some <strong>of</strong> the<br />
structures have back doors and windows that are low points <strong>of</strong> entry. The recommended<br />
floodpro<strong>of</strong>ing measure for each structure in the King Street focus area, as well as the level <strong>of</strong><br />
protection it would provide, is shown on Figure 6-10.<br />
Table 6-16: <strong>Flood</strong>pro<strong>of</strong>ing Options for King Street: 6 Residential Structures<br />
Method Cost/Structure Structures That Could Benefit<br />
<strong>Flood</strong> Gate $900 6<br />
<strong>Flood</strong>pro<strong>of</strong> Openings<br />
Door $10,000 6<br />
Window $3,000 2<br />
Raise Patio/Fill $8,000 2<br />
Because the most expensive floodpro<strong>of</strong>ing scenario is to floodpro<strong>of</strong> the doors and windows, it<br />
was assumed that this technique would be used whenever feasible.<br />
As shown in Table 6-17, the floodpro<strong>of</strong>ing BCA results in a BCR <strong>of</strong> 11.6. Because the most<br />
expensive floodpro<strong>of</strong>ing scenario is cost effective, any combination <strong>of</strong> dry floodpro<strong>of</strong>ing<br />
techniques used for residential structures in the King Street focus area will also be cost effective.<br />
Table 6-17: Benefit Cost Ratio King Street: 6 Residential Structures<br />
Method Cost/Structure # Structures Units/Structure Total Cost<br />
<strong>Flood</strong>pro<strong>of</strong> Openings<br />
Door $10,000 6 1.33 $80,000<br />
Window $3,000 2 3.00 $18,000<br />
Total Cost = $98,000<br />
Total Benefit = $1,134,000<br />
BCR = 11.6<br />
28-JUL-10\\ 6-39
N FAIRFAX ST<br />
CLIENT<br />
PROJ<br />
REVISION NO<br />
SCALE<br />
SWIFTS AL<br />
<strong>City</strong> <strong>of</strong> <strong>Alexandria</strong><br />
RAMSAY AL<br />
S LEE ST<br />
N LEE ST<br />
<strong>Potomac</strong> River <strong>Waterfront</strong> <strong>Flood</strong> <strong>Mitigation</strong> <strong>Study</strong><br />
1 inch = 100 feet<br />
W:\<strong>City</strong> <strong>of</strong> <strong>Alexandria</strong>\15298470 - Lower King St\Task 3\Report<br />
\Final\Figures\MXDs\F6-10 King_Street_Area.mxd<br />
0 DES BY<br />
DR BY<br />
CHK BY<br />
JEA<br />
xxx<br />
xxx<br />
09/22/09<br />
00/00/00<br />
00/00/00<br />
KING ST<br />
CAMERON ST<br />
FAYETTE AL<br />
WALES AL<br />
PRINCE ST<br />
0 25 50 100<br />
Feet<br />
TITLE<br />
S UNION ST<br />
DUKE ST<br />
N UNION ST<br />
WALES AL<br />
Legend<br />
Focus Area<br />
STRAND ST<br />
STRAND ST<br />
King Street Focus Area <strong>Flood</strong>pro<strong>of</strong>ing Options<br />
200 Orchard Ridge Drive<br />
Gaithersburg, MD 20878<br />
CAMERON ST<br />
<strong>Flood</strong>pro<strong>of</strong> Openings to protect from Extreme <strong>Flood</strong><br />
<strong>Flood</strong>pro<strong>of</strong> Openings to protect from Intermediate <strong>Flood</strong><br />
Internal Elevation to Protect from Intermediate <strong>Flood</strong><br />
Internal Elevation to Protect from Less than Extreme <strong>Flood</strong><br />
Internal Elevation to Protect from Less than Intermediate <strong>Flood</strong><br />
Above Extreme <strong>Flood</strong><br />
Outside Focus Area<br />
Note: <strong>Flood</strong>pro<strong>of</strong>ing may also be feasible for structures<br />
recommended for internal elevation<br />
PROJ NO<br />
FIGURE<br />
6-10<br />
15298592
<strong>Waterfront</strong> Commercial<br />
Structural <strong>Mitigation</strong> Measure Concepts<br />
Approximately 22 structures in the <strong>Waterfront</strong> Commercial focus area would flood during the<br />
extreme storm. About 16 <strong>of</strong> these have an extreme flood depth greater than 3 feet and thus can<br />
not be floodpro<strong>of</strong>ed from the extreme flood. However, approximately 14 <strong>of</strong> the 18 structures that<br />
are susceptible to the intermediate flood can be floodpro<strong>of</strong>ed from this flood event. Only two<br />
structures in this focus area are impacted by nuisance flooding, and both can be floodpro<strong>of</strong>ed.<br />
None <strong>of</strong> these structures have basements, and it is assumed that they do not have openings below<br />
the first floor elevation.<br />
Table 6-18 shows the different dry floodpro<strong>of</strong>ing options and the approximate number <strong>of</strong><br />
structures within the <strong>Waterfront</strong> Commercial focus area that might benefit from each measure.<br />
Approximately 22 structures could benefit from floodpro<strong>of</strong>ing the doors and windows. Most <strong>of</strong><br />
the structures could use a flood gate, but floodpro<strong>of</strong> doors are recommended instead <strong>of</strong><br />
floodgates for commercial properties because they are a passive system <strong>of</strong> flood protection.<br />
Eight buildings in the <strong>Waterfront</strong> Commercial focus area that are at risk <strong>of</strong> flooding appear to be<br />
candidates for internal elevation. These include <strong>Alexandria</strong> Marine, Art League, Robinson South<br />
Terminal, the street level shops on Union Street, and Chadwicks. In addition, the shops on Strand<br />
Street (<strong>Potomac</strong> Riverboat/chiropractor/Idea Sciences) appear to have suspended ceilings. They<br />
may be candidates for internal elevation if the suspended ceiling height can be raised.<br />
Raising the lowest adjacent grade is not feasible in this focus area, because most <strong>of</strong> these<br />
structures would be inundated by floodwater on all sides. The remaining structures tend to have<br />
two doors and several windows close to the FFE; therefore, those openings are recommended for<br />
floodpro<strong>of</strong>ing. The recommended floodpro<strong>of</strong>ing measure for each structure in the <strong>Waterfront</strong><br />
Commercial focus area, as well as the level <strong>of</strong> protection it would provide, is shown on Figure<br />
6-11.<br />
Table 6-18: <strong>Flood</strong>pro<strong>of</strong>ing Options for <strong>Waterfront</strong> Commercial: 22 Commercial Structures<br />
Method Cost/Structure Structures That Could Benefit<br />
<strong>Flood</strong> Gate $900 22<br />
<strong>Flood</strong>pro<strong>of</strong> Openings<br />
Door $10,000 22<br />
Window $6,000 22<br />
Internal Elevation $646,000 6<br />
Because the most expensive floodpro<strong>of</strong>ing scenario is internal elevation, it was assumed that this<br />
technique would be used whenever feasible.<br />
As shown in Table 6-19, the floodpro<strong>of</strong>ing BCA results in a BCR <strong>of</strong> 2.41. Because the most<br />
expensive floodpro<strong>of</strong>ing scenario is cost effective, any combination <strong>of</strong> dry floodpro<strong>of</strong>ing<br />
techniques used for the <strong>Waterfront</strong> Commercial focus area will also be cost effective.<br />
28-JUL-10\\ 6-41
S ROYAL ST<br />
CLIENT<br />
PROJ<br />
N PITT ST<br />
REVISION NO<br />
SCALE<br />
PRINCE ST<br />
S FAIRFAX ST<br />
N ROYAL ST<br />
<strong>City</strong> <strong>of</strong> <strong>Alexandria</strong><br />
ORONOCO ST<br />
QUEEN ST<br />
DUKE ST<br />
N FAIRFAX ST<br />
CAMERON ST<br />
SWIFTS AL<br />
HOPKINS CT<br />
TANCIL CT<br />
THOMPSONS AL<br />
RAMSAY AL<br />
KING ST<br />
S LEE ST<br />
<strong>Potomac</strong> River <strong>Waterfront</strong> <strong>Flood</strong> <strong>Mitigation</strong> <strong>Study</strong><br />
1 inch = 250 feet<br />
W:\<strong>City</strong> <strong>of</strong> <strong>Alexandria</strong>\15298470 - Lower King St\Task 3\Report<br />
\Final\Figures\MXDs\F6-11 <strong>Waterfront</strong>_Area.mxd<br />
0 DES BY<br />
DR BY<br />
CHK BY<br />
CJL<br />
CJL<br />
MER<br />
WOLFE ST<br />
09/11/09<br />
09/24/09<br />
10/04/09<br />
TOBACCO QY<br />
N LEE ST<br />
PRINCESS ST<br />
FAYETTE AL<br />
WALES AL<br />
WATERFORD PL<br />
S UNION ST<br />
PENDLETON ST<br />
QUAY ST<br />
CAMERON ME<br />
N UNION ST<br />
0 65 130 260<br />
Feet<br />
STRAND ST<br />
THOMPSONS AL<br />
CAMERON ST<br />
S UNION STSTRAND<br />
ST<br />
TITLE<br />
Legend<br />
Focus Area<br />
200 Orchard Ridge Drive<br />
Gaithersburg, MD 20878<br />
Internal Elevation to Protect from Extreme <strong>Flood</strong><br />
Internal Elevation to Protect from Less than Intermediate <strong>Flood</strong><br />
<strong>Flood</strong>pro<strong>of</strong> Openings to Protect from Less than Intermediate <strong>Flood</strong><br />
<strong>Flood</strong>pro<strong>of</strong> Openings to Protect from Nuisance <strong>Flood</strong><br />
<strong>Flood</strong>pro<strong>of</strong> Openings to Protect from Intermediate <strong>Flood</strong><br />
<strong>Flood</strong>pro<strong>of</strong> Openings to Protect from Extreme <strong>Flood</strong><br />
Above Extreme <strong>Flood</strong><br />
Outside Focus Area<br />
<strong>Waterfront</strong> Focus Area <strong>Flood</strong>pro<strong>of</strong>ing Options<br />
<strong>Potomac</strong> River<br />
Note: <strong>Flood</strong>pro<strong>of</strong>ing may also be feasible for structures<br />
recommended for internal elevation<br />
PROJ NO<br />
FIGURE<br />
6-11<br />
15298592
Structural <strong>Mitigation</strong> Measure Concepts<br />
Table 6-19: Benefit Cost Ratio for <strong>Waterfront</strong> Commercial: 22 Commercial Structures<br />
Method Cost/Structure # Structures Units/Structure Total Cost<br />
<strong>Flood</strong>pro<strong>of</strong> Openings<br />
Door $10,000 16 2 $160,000<br />
Window $6,000 16 3 $96,000<br />
Internal Elevation $646,000 6 1 $3,874,000<br />
North Union Street<br />
Total Cost = $2,790,000<br />
Total Benefit = $6,728,000<br />
BCR = 2.41<br />
Approximately 37 structures (including 9 apartments) within the North Union Street focus area<br />
would flood during the extreme storm. Many <strong>of</strong> these have basements; however, as noted<br />
previously, floodpro<strong>of</strong>ing for structures with basements is recommended on a case-by-case basis.<br />
Most <strong>of</strong> these buildings have extreme flood depths less than 3 feet and can be protected from the<br />
extreme flood by dry floodpro<strong>of</strong>ing. The only exceptions are the Torpedo Factory Apartments.<br />
The apartments themselves are above the extreme flood elevation. However, there is storage<br />
space at ground level that is susceptible to the intermediate and extreme floods.<br />
Based on the available topographic data, it appears that the structures in this focus area would<br />
flood from water coming <strong>of</strong>f the street. Therefore, it is not necessary to consider floodpro<strong>of</strong>ing<br />
the back <strong>of</strong> the structures. A potential exceptions to this are the houses along Cameron Mews,<br />
because these structures are vulnerable to flooding from Cameron Street and Thompsons Alley.<br />
Many <strong>of</strong> the structures in the North Union Street focus area have garages that would flood.<br />
<strong>Flood</strong>gates are likely the only available option for floodpro<strong>of</strong>ing garage doors.<br />
Table 6-20 provides the different dry floodpro<strong>of</strong>ing options and the approximate number <strong>of</strong><br />
structures within the North Union Street focus area that might benefit from each. Most <strong>of</strong> the<br />
structures could make use <strong>of</strong> a flood gate for the garage. All <strong>of</strong> these buildings are row houses.<br />
Therefore, all units that are at risk <strong>of</strong> flooding within the row need to be floodpro<strong>of</strong>ed. The only<br />
unit in its row to be at risk <strong>of</strong> flooding is 107 Cameron Mews. Therefore, both floodpro<strong>of</strong>ing the<br />
points <strong>of</strong> entry or raising the lowest adjacent grade are reasonable options for this unit. The<br />
recommended floodpro<strong>of</strong>ing measure for each structure in the North Union Street focus area, as<br />
well as the level <strong>of</strong> protection it would provide, is shown on Figure 6-12.<br />
Table 6-20: Dry <strong>Flood</strong>pro<strong>of</strong>ing Options for North Union: 37 Residential Structures<br />
Method Cost/Structure Structures That Could Benefit<br />
<strong>Flood</strong> Gate $900 37<br />
<strong>Flood</strong>pro<strong>of</strong> Openings<br />
Door $10,000 37<br />
Raise Patio/Fill $8,000 1<br />
28-JUL-10\\ 6-43
N FAIRFAX ST<br />
THOMPSONS AL<br />
CLIENT<br />
PROJ<br />
REVISION NO<br />
SCALE<br />
<strong>City</strong> <strong>of</strong> <strong>Alexandria</strong><br />
N LEE ST<br />
PRINCESS ST<br />
CAMERON ST<br />
<strong>Potomac</strong> River <strong>Waterfront</strong> <strong>Flood</strong> <strong>Mitigation</strong> <strong>Study</strong><br />
1 inch = 100 feet<br />
W:\<strong>City</strong> <strong>of</strong> <strong>Alexandria</strong>\15298470 - Lower King St\Task 3\Report<br />
\Final\Figures\MXDs\F6-12 North_Union_Area.mxd<br />
0 DES BY<br />
DR BY<br />
CHK BY<br />
JEA<br />
xxx<br />
xxx<br />
QUAY ST<br />
QUEEN ST<br />
CAMERON ME<br />
09/22/09<br />
00/00/00<br />
00/00/00<br />
0 25 50 100<br />
Feet<br />
TITLE<br />
N UNION ST<br />
ORONOCO ST<br />
THOMPSONS AL<br />
Legend<br />
CAMERON ST<br />
Focus Area<br />
<strong>Flood</strong>pro<strong>of</strong> Openings to Protect from Extreme <strong>Flood</strong><br />
Raise LAG to Protect from Extreme <strong>Flood</strong><br />
<strong>Flood</strong>pro<strong>of</strong> Openings to Protect from Less than Intermediate <strong>Flood</strong><br />
Above Extreme <strong>Flood</strong><br />
Outside Focus Area<br />
North Union Focus Area <strong>Flood</strong>pro<strong>of</strong>ing Options<br />
200 Orchard Ridge Drive<br />
Gaithersburg, MD 20878<br />
PROJ NO<br />
FIGURE<br />
<strong>Potomac</strong> River<br />
6-12<br />
15298592
Structural <strong>Mitigation</strong> Measure Concepts<br />
Because the most expensive floodpro<strong>of</strong>ing scenario is to install floodpro<strong>of</strong>ed doors and<br />
windows, it was assumed that this technique would be used whenever feasible.<br />
As shown in Table 6-21, the floodpro<strong>of</strong>ing BCA results in a BCR <strong>of</strong> 1.29. Because the most<br />
expensive floodpro<strong>of</strong>ing scenario is cost effective, any combination <strong>of</strong> dry floodpro<strong>of</strong>ing<br />
techniques used for the North Union focus area will also be cost effective.<br />
Table 6-21: Benefit Cost Ratio for North Union: 37 Residential Structures<br />
Method Cost/Structure # Structures Units/Structure Total Cost<br />
<strong>Flood</strong> Gate $900 25 2 $34,000<br />
<strong>Flood</strong>pro<strong>of</strong> Openings<br />
Door $10,000 40 1.33 $532,000<br />
6.6.5 <strong>Flood</strong>pro<strong>of</strong>ing Applicability for Repetitive Loss Properties<br />
Total Cost = $568,000<br />
Total Benefit = $734,000<br />
BCR = 1.29<br />
Specific information for application <strong>of</strong> floodpro<strong>of</strong>ing for repetitive loss properties is summarized<br />
in Table 6-22 below.<br />
Table 6-22: Summary <strong>of</strong> <strong>Flood</strong>pro<strong>of</strong>ing Applicability for Repetitive Loss Properties<br />
Repetitive Loss<br />
Property<br />
1 King Street (Boat<br />
Club)<br />
6 King Street (Mai<br />
Thai / Starbucks)<br />
101 King Street<br />
(Conrad’s<br />
Furniture)<br />
First floor<br />
Elevation<br />
(NAVD88)<br />
Internal Elevation Raise the LAG<br />
3.75 feet Not applicable due<br />
to ceiling height<br />
3.51 feet Not applicable due<br />
to ceiling height<br />
5.01 feet Not applicable due<br />
to ceiling height<br />
104 South Union 4.50 feet Not applicable due<br />
to ceiling height<br />
120 Cameron<br />
Street<br />
4.6 feet Not applicable as<br />
the lowest finished<br />
floor is above the<br />
extreme flood<br />
elevation<br />
Not applicable as<br />
the structure is<br />
susceptible to<br />
flooding on all sides<br />
Not applicable as<br />
the structure is<br />
susceptible to<br />
flooding on all sides<br />
Not applicable<br />
because FFE is<br />
above sidewalk<br />
Not applicable as<br />
the structure is<br />
susceptible to<br />
flooding on all sides<br />
Not applicable as<br />
the lowest finished<br />
floor is above the<br />
extreme flood<br />
elevation<br />
<strong>Flood</strong>pro<strong>of</strong><br />
Openings<br />
Potential option<br />
Potential option<br />
Potential option<br />
Potential option<br />
Potential option<br />
28-JUL-10\\ 6-45
SECTION SEVEN: RECOMMENDATIONS<br />
7.1 OVERVIEW OF RECOMMENDATIONS<br />
Recommendations<br />
Ten flood mitigation measures were analyzed in detail. Because no clear single measure provides<br />
flood protection for the entire project area and is technically feasible without extensive resulting<br />
impacts, this section recommends a series <strong>of</strong> options for each <strong>of</strong> the focus areas. Table 7-1<br />
provides descriptions <strong>of</strong> the ten flood mitigation measures for which a detailed evaluation was<br />
conducted. The measures are not applicable for all structures or focus areas, and the measures<br />
have limitations on their use as described in the previous sections. Table 7-1 summarizes the<br />
limitations for each mitigation measure and lists the focus areas that benefit from each measure.<br />
Table 7-1: Applicability <strong>of</strong> <strong>Flood</strong> <strong>Mitigation</strong> Measures<br />
Description Limitations<br />
<strong>Flood</strong>pro<strong>of</strong>ing<br />
Acquire properties<br />
Elevate structures<br />
<strong>Flood</strong>wall<br />
Applicable for flood depths <strong>of</strong> less than 3<br />
feet for structures with no basements<br />
Applicable for stand alone structures or<br />
where all attached units in the structure are<br />
affected by flooding<br />
Applicable for wood structures, single-story<br />
structures. Not recommended for historic<br />
structures<br />
High project costs and significant aesthetic<br />
and humanistic impacts<br />
Recommended Focus<br />
Area<br />
All<br />
Not recommended<br />
Not recommended<br />
<strong>Waterfront</strong> Commercial,<br />
King Street<br />
Jones Point berm High project costs Not recommended<br />
Elevated walkway<br />
Inlet and road elevation<br />
improvements<br />
Relocate internal supplies<br />
<strong>Flood</strong>plain and zoning<br />
ordinance<br />
recommendations<br />
Sandbag program<br />
improvements<br />
Maximum height <strong>of</strong> pedestrian floodwall is<br />
6.0 feet NAVD, which does not protect<br />
against large storms<br />
Adjacent curbs and building entrances limit<br />
level <strong>of</strong> protection<br />
Most applicable in commercial<br />
establishments<br />
<strong>Waterfront</strong> Commercial<br />
King Street<br />
King Street<br />
<strong>Waterfront</strong> Commercial<br />
King Street<br />
No limitations All<br />
No limitations All<br />
The remainder <strong>of</strong> this section presents the recommendations in the following order: focus areas,<br />
floodwall, and nonstructural options. The floodwall and nonstructural measures are discussed<br />
after the focus area discussion because they protect multiple focus areas.<br />
28-JUL-10\\ 7-1
7.2 KING STREET<br />
Elevated Walkway<br />
Recommendations<br />
The elevated walkway is recommended as the primary flood mitigation measure for this focus<br />
area. This flood control project protects up to the 10-year flood event, and the reduced height and<br />
design <strong>of</strong> the walkway are more aesthetically pleasing than the floodwall. The elevated walkway<br />
does not significantly impact the <strong>Potomac</strong> River viewshed. Figures 7-1, 7-2, and 7-3 show<br />
visualizations <strong>of</strong> the proposed walkway. These visualizations are examples <strong>of</strong> a potential<br />
configuration for the walkway. The low pr<strong>of</strong>ile floodwall at elevation 6 feet (NAVD 88) is the<br />
critical flood control element for the elevated walkway. This option allows for a new pedestrian<br />
pathway that can be implemented in conjunction with the <strong>Waterfront</strong> Plan improvements. It<br />
would significantly reduce the frequency <strong>of</strong> sandbagging efforts and road closures in the<br />
downtown area.<br />
28-JUL-10\\ 7-2
Figure 7-1: Elevated Walkway at <strong>Waterfront</strong> Park (View 1)<br />
Recommendations<br />
28-JUL-10\\ 7-3
Figure 7-2: Elevated Walkway at <strong>Waterfront</strong> Park (View 2)<br />
Recommendations<br />
28-JUL-10\\ 7-4
Recommendations<br />
Figure 7-3: Elevated Walkway at Park South <strong>of</strong> Parking Lot on Strand Street<br />
28-JUL-10\\ 7-5
Recommendations<br />
The elevated walkway is limited in that it only provides protection for up to the 10-year flood<br />
event (elevation 6.0 feet NAVD). Figure 7-4 shows a rendering <strong>of</strong> the before and after<br />
inundation at The Strand during the 10-year flood event.<br />
Figure 7-4: 10-Year <strong>Flood</strong> Inundation Before and After Elevated Pedestrian Walkway<br />
Figure 7-5 shows the structures that are predicted to be protected by the elevated walkway. The<br />
proposed elevated walkway protects approximately one-third <strong>of</strong> the structures in the King Street<br />
focus area. In addition, this measure significantly reduces the frequency <strong>of</strong> road flooding in the<br />
vicinity <strong>of</strong> Strand Street.<br />
<strong>Flood</strong>pro<strong>of</strong>ing<br />
Before After<br />
<strong>Flood</strong>pro<strong>of</strong>ing is recommended to provide protection for all the commercial structures. As<br />
discussed throughout the report, the historic nature <strong>of</strong> the area poses challenges to floodpro<strong>of</strong>ing.<br />
However, it is an effective option for property owners to protect building contents. The<br />
recommendation consists <strong>of</strong> a combination <strong>of</strong> internal elevation <strong>of</strong> commercial buildings and<br />
floodpro<strong>of</strong>ing openings, with gates and custom floodpro<strong>of</strong> doors and windows. There are<br />
approximately eight commercial structures within this focus area where internal elevation would<br />
be feasible, including 100 King Street, Windsor Studio, Ben & Jerry’s, Firehook Bakery, Art<br />
Craft, Old Town Trading Post, The Small Mall, and Christmas Attic.<br />
For historic brick structures, waterpro<strong>of</strong> membranes to cover the outside <strong>of</strong> the structures are not<br />
recommended. Residential structures in the focus area that have basements will need to be<br />
considered separately to determine the applicability <strong>of</strong> floodpro<strong>of</strong>ing measures for those<br />
structures.<br />
28-JUL-10\\ 7-6
N FAIRFAX ST<br />
CLIENT<br />
PROJ<br />
REVISION NO<br />
SCALE<br />
THOMPSONS AL<br />
RAMSAY AL<br />
SWIFTS AL<br />
S LEE ST<br />
DUKE ST<br />
<strong>City</strong> <strong>of</strong> <strong>Alexandria</strong><br />
N LEE ST<br />
CAMERON ST<br />
KING ST<br />
WALES AL<br />
FAYETTE AL<br />
QUEEN ST<br />
CAMERON ME<br />
<strong>Potomac</strong> River <strong>Waterfront</strong> <strong>Flood</strong> <strong>Mitigation</strong> <strong>Study</strong><br />
1 inch = 150 feet<br />
W:\<strong>City</strong> <strong>of</strong> <strong>Alexandria</strong>\15298470 - Lower King St\Task 3\Report<br />
\Final\Figures\MXDs\F7-5 Buildings Protect by Elevated Walkway.mxd<br />
0 DES BY<br />
DR BY<br />
CHK BY<br />
CJL<br />
CJL<br />
MER<br />
S UNION ST<br />
09/11/09<br />
09/24/09<br />
10/04/09<br />
QUAY ST<br />
WALES AL<br />
PRINCE ST<br />
STRAND ST<br />
N UNION ST<br />
STRAND ST<br />
0 37.5 75 150<br />
Feet<br />
THOMPSONS AL<br />
CAMERON ST<br />
TITLE<br />
Legend<br />
Structures Predicted to be Protected by the Proposed Elevated Walkway<br />
200 Orchard Ridge Drive<br />
Gaithersburg, MD 20878<br />
Structures protected by the elevated walkway based on FFE data<br />
Structures protected by the elevated walkway based on topo<br />
Elevated Walkway<br />
550 foot floodwall<br />
Inundation area prior to construction <strong>of</strong> elevated walkway<br />
Buildings<br />
Note: Structures not shaded blue within the<br />
inundation area have a FFE above six feet<br />
PROJ NO<br />
FIGURE<br />
7-5<br />
15298592
King/Strand Street Intersection Roadway Improvements<br />
Recommendations<br />
It may be many years before construction <strong>of</strong> the elevated walkway is complete. Through that<br />
timeframe, the King/Strand Street area roadways will continue to be closed for storm events that<br />
are less than the nuisance event. The roadway improvement project is relatively simple and has a<br />
low cost compared to the other alternatives. As a result, it is recommended that the <strong>City</strong> consider<br />
implementing this alternative as described in the conceptual design presented in Section 6.7 as an<br />
interim flood mitigation measure.<br />
7.3 WATERFRONT COMMERCIAL<br />
Elevated Walkway<br />
As mentioned above, the elevated walkway is recommended as the primary flood mitigation<br />
measure for this study area. The elevated walkway provides protection for up to the 10-year<br />
(elevation 6.0 feet NAVD88) flood event for seven buildings in this study area with FFEs below<br />
6.0 feet. Because most <strong>of</strong> the flood damages occur at the more frequent events, the elevated<br />
walkway provides substantial benefits as compared to the cost <strong>of</strong> the project, as seen by the<br />
BCR. Additionally, some <strong>of</strong> the aesthetic and viewshed issues with the larger floodwall<br />
(discussed below) are not present.<br />
<strong>Flood</strong>pro<strong>of</strong>ing<br />
While the proposed elevated walkway does not protect all structures in the Commercial<br />
<strong>Waterfront</strong> focus area, the floodpro<strong>of</strong>ing option could protect commercial structures up to the<br />
intermediate storm event, with the exception <strong>of</strong> the Mai Thai Restaurant, Starbucks, and Old<br />
Dominion Boat Club. As discussed throughout the report, the historic nature <strong>of</strong> the area poses<br />
challenges to floodpro<strong>of</strong>ing. However, it is an effective option for property owners to protect<br />
building contents. The recommendation for the entire area is floodpro<strong>of</strong>ing openings with gates<br />
and custom floodpro<strong>of</strong> doors and windows. During field visits, the low floor to ceiling heights<br />
within the buildings eliminated internal elevation from consideration.<br />
For historic brick structures, waterpro<strong>of</strong> membranes to cover the outside <strong>of</strong> the structures are not<br />
recommended. <strong>Flood</strong>pro<strong>of</strong>ing through internal elevation and covering openings is also an option,<br />
although the flooding depths are greater in this area, so the method is not applicable for as many<br />
structures as in the King Street focus area. Residential structures that have basements will need<br />
to be considered separately to determine the applicability <strong>of</strong> floodpro<strong>of</strong>ing measures for those<br />
structures.<br />
Acquisition<br />
Acquisition is not generally recommended in this study because it is not a cost-effective<br />
alternative. However, the <strong>City</strong> recently purchased waterfront properties as part <strong>of</strong> the waterfront<br />
redevelopment initiative. The <strong>City</strong> may decide to acquire additional waterfront properties as part<br />
<strong>of</strong> the waterfront initiative. The purpose <strong>of</strong> the acquisition in this case is economic development<br />
rather than flood mitigation.<br />
28-JUL-10\\ 7-8
7.4 NORTH UNION<br />
Recommendations<br />
<strong>Flood</strong>pro<strong>of</strong>ing is recommended for this study area, primarily through covering openings. This is<br />
a cost-effective and low-impact solution <strong>of</strong> flood protection for this study area. As discussed<br />
throughout the report, the historic nature <strong>of</strong> the area poses challenges to floodpro<strong>of</strong>ing. However,<br />
it appears to be an effective option for property owners to protect building contents. Residential<br />
structures that have basements will need to be considered separately to determine the<br />
applicability <strong>of</strong> floodpro<strong>of</strong>ing measures for those structures.<br />
7.5 JONES POINT<br />
<strong>Flood</strong>pro<strong>of</strong>ing is recommended for this study area, primarily through covering openings. The<br />
floodpro<strong>of</strong>ing option could protect all the residential structures that are impacted by flooding <strong>of</strong><br />
up to the extreme flood event. As discussed throughout the report, the historic nature <strong>of</strong> the area<br />
poses challenges to floodpro<strong>of</strong>ing. However, it is an effective option for property owners to<br />
protect building contents. The recommendation consists <strong>of</strong> a combination <strong>of</strong> localized flood<br />
barriers (e.g. raised patios) and floodpro<strong>of</strong>ing openings, with gates and custom floodpro<strong>of</strong> doors<br />
and windows.<br />
For historic brick structures, waterpro<strong>of</strong> membranes to cover the outside <strong>of</strong> the structures are not<br />
recommended. Residential structures in the focus area that have basements will need to be<br />
considered separately to determine the applicability <strong>of</strong> floodpro<strong>of</strong>ing measures for those<br />
structures.<br />
7.6 FLOODWALL<br />
Our preliminary investigations show that the floodwall is a technically feasible solution that<br />
provides protection for all <strong>of</strong> the structures in the King Street focus area, all but one structure in<br />
the <strong>Waterfront</strong> Commercial focus area, and the Cameron Mews portion <strong>of</strong> the North Union focus<br />
area from the nuisance, intermediate, and extreme flood events. The floodwall would remove the<br />
repetitive loss properties from the floodplain. While the floodwall is not as cost effective as the<br />
other alternatives analyzed, it is technically feasible. Additionally, it is the only option for the<br />
King Street focus area that effectively provides protection against the 100-year flood event.<br />
However, the floodwall may not be a palatable option for area businesses, residents, and tourists.<br />
Its substantial viewshed and aesthetic impacts may prevent this measure from gaining public<br />
support. Because residential and commercial access to the river is an essential part <strong>of</strong> the<br />
<strong>Alexandria</strong> economy, those are also important considerations. An additional factor is the<br />
potential for increased <strong>City</strong> liability, specifically if redundant systems fail and residential<br />
structures flood. Figures 7-5 and 7-6 illustrate the visual impact <strong>of</strong> the proposed floodwall<br />
concept.<br />
Another important aspect for consideration <strong>of</strong> the floodwall is that the BCR is low due to the<br />
high cost <strong>of</strong> the project. In comparison, the elevated walkway cost-effectively provides<br />
protection against the frequent storm events and has a high BCR. It is recommended that the<br />
floodwall be implemented only if the <strong>City</strong>’s sole priority is to reduce all flooding to the<br />
maximum extent technically feasible. Otherwise, the floodwall is not recommended over other<br />
flood mitigation measures described in this section.<br />
28-JUL-10\\ 7-9
Figure 7-6: <strong>Flood</strong>wall behind Torpedo Factory<br />
Recommendations<br />
28-JUL-10\\ 7-10
Figure 7-7: <strong>Flood</strong>wall in Front <strong>of</strong> Chart House<br />
Recommendations<br />
28-JUL-10\\ 7-11
7.7 REPETITIVE LOSS PROPERTIES<br />
Recommendations<br />
For emphasis, recommendations that affect the repetitive loss properties are summarized in this<br />
section.<br />
1 King Street (Boat Club)<br />
This structure has a first-floor base elevation <strong>of</strong> 3.76 feet (NAVD 88). Because it is not<br />
recommended to floodpro<strong>of</strong> a structure above a height <strong>of</strong> 3 feet, this building can be<br />
floodpro<strong>of</strong>ed to an elevation <strong>of</strong> approximately 6.75 feet. This will protect it from nuisance<br />
flooding, but not intermediate or extreme floods. There are at least three exterior doorways at<br />
ground level that could be floodpro<strong>of</strong>ed with a gate. This is a relatively inexpensive solution.<br />
However, because it is an active system, someone would have to be available to install them after<br />
the flood warning. There are no windows that are low enough to benefit from floodpro<strong>of</strong>ing.<br />
Additionally, the elevated walkway would provide protection for this structure against nuisance<br />
flooding.<br />
6 King Street (Mai Thai / Starbucks)<br />
This structure has a first-floor base elevation <strong>of</strong> 3.51 feet (NAVD 88). Because it is not<br />
recommended to floodpro<strong>of</strong> a structure above a height <strong>of</strong> 3 feet, this building can be<br />
floodpro<strong>of</strong>ed to an elevation <strong>of</strong> approximately 6.5 feet. This will protect it from nuisance<br />
flooding but not intermediate or extreme floods. There are four doorways to this structure that<br />
could be floodpro<strong>of</strong>ed with a gate. This is a relatively inexpensive solution. However, because it<br />
is an active system, someone would have to be available to install them after the flood warning.<br />
This building has approximately 10 windows that appear low enough to benefit from<br />
floodpro<strong>of</strong>ing.<br />
101 King Street (Conrad’s Furniture)<br />
This building has a first floor elevation <strong>of</strong> 5.01 feet (NAVD 88). This means that it is not<br />
impacted by nuisance flooding. It can be floodpro<strong>of</strong>ed up to the intermediate flood elevation, but<br />
it will not be protected from the extreme flood event. Three doorways on the southern side, one<br />
doorway on the eastern side <strong>of</strong> this building, and one window on the eastern side would all need<br />
to be floodpro<strong>of</strong>ed. Additionally, the elevated walkway would provide protection for this<br />
structure against nuisance flooding.<br />
104 South Union<br />
The first floor <strong>of</strong> this building is at 4.5 feet (NAVD 88). Therefore, it is not affected by nuisance<br />
flooding. It can be floodpro<strong>of</strong>ed up to approximately 7.5 feet and, therefore, cannot be fully<br />
protected from the intermediate and extreme flood events. Nevertheless, floodpro<strong>of</strong>ing can<br />
significantly reduce the probability <strong>of</strong> flood-related damages to this property. <strong>Flood</strong>pro<strong>of</strong>ing <strong>of</strong><br />
the structure openings including a doorway on the northern side and a doorway on the western<br />
side <strong>of</strong> this building is recommended. Three low windows on the western side <strong>of</strong> the structure<br />
would also need to be floodpro<strong>of</strong>ed. Additionally, the elevated walkway would provide<br />
protection for this structure against nuisance flooding.<br />
28-JUL-10\\ 7-12
120 Cameron Street<br />
Recommendations<br />
As mentioned previously, the first floor <strong>of</strong> this structure is above the extreme flood elevation.<br />
Based on our review <strong>of</strong> available data, the first floor is elevated more than 3 feet above the<br />
ground with storage space underneath. However, since this property is identified by FEMA as a<br />
repetitive loss structure, floodpro<strong>of</strong>ing <strong>of</strong> the openings is recommended.<br />
7.8 NONSTRUCTURAL FLOOD MITIGATION MEASURES<br />
In addition to the structural flood mitigation measures recommended for implementation,<br />
nonstructural flood mitigation measures are also recommended for implementation. The<br />
recommendations consist <strong>of</strong> action items under three nonstructural mitigation measures selected<br />
for further evaluation, as described in Section 2. The following list provides a summary <strong>of</strong> the<br />
recommendations. Additional detail on the recommendations is provided in Section 3.<br />
Improve <strong>Flood</strong>plain Zoning Ordinances<br />
Cumulative Substantial Improvements – It is recommended that the <strong>City</strong> interpret the 50<br />
percent improvement threshold as cumulative. Implementing this measure will result in<br />
increased CRS points.<br />
Lower Substantial Improvements – It is recommended that the <strong>City</strong> consider lowering the<br />
improvement threshold for substantial improvements to less than 50 percent.<br />
Protection <strong>of</strong> Critical Facilities – If the GIS data reviewed is accurate and there are no plans<br />
to build new critical facilities within the 500-year floodplain, implementing this measure will<br />
result in increased CRS points.<br />
Staff Training – It is recommended that staff involved in reviewing plans and issuing<br />
permits for floodplain development and conducting field inspections become CFMs.<br />
Implementing this measure will result in increased CRS points.<br />
Permitting and Inspection – It is recommended that the <strong>City</strong> increase the frequency <strong>of</strong><br />
inspecting new construction to ensure that the work is being done according to the provisions<br />
<strong>of</strong> the floodplain ordinance. The ordinance can also be amended to give the floodplain<br />
administrator the right to issue a stop work order or revoke building permits if the inspections<br />
show that a violation has taken place.<br />
Accessory Structures – It is recommended that additional regulations regarding accessory<br />
structures such as sheds and garages be added to strengthen the existing ordinances to<br />
prevent accessory structures from being constructed in the floodplain,<br />
Variances – Although the <strong>City</strong> does not grant variances related to floodplain protection<br />
<strong>of</strong>ten, it is recommended that the <strong>City</strong> consider strengthening language to ensure that future<br />
floodplain variances are discouraged.<br />
Requiring 1 Foot <strong>of</strong> Freeboard – It is recommended that the <strong>City</strong> require 1 foot <strong>of</strong><br />
freeboard above the flood elevation for new construction. This consistent with the <strong>City</strong> <strong>of</strong><br />
<strong>Alexandria</strong> building code which references the Virginia Uniform Statewide Building Code<br />
28-JUL-10\\ 7-13
Recommendations<br />
(USBC) and International Building Code (IBC). The IBC requires 1 foot <strong>of</strong> freeboard above<br />
the FFE.<br />
Elevation <strong>of</strong> Supplies and Goods<br />
Elevation <strong>of</strong> supplies and goods is recommended for eight commercial structures that<br />
experience nuisance flooding. These structures are listed in Table 3-1. Another important<br />
component <strong>of</strong> this solution is outreach and education to residents and business owners who<br />
could benefit from elevation <strong>of</strong> supplies and goods.<br />
Sandbagging and Other Temporary Measures<br />
The <strong>City</strong> currently maintains a sandbag distribution guidelines for affected businesses and<br />
residential areas within the <strong>Potomac</strong> River waterfront area. It is recommended that the <strong>City</strong><br />
maintain the sandbag program and consider the following changes to the current sandbag<br />
policy:<br />
Expand the sandbag service areas to include a self-serve sand drop <strong>of</strong>f point at 400 North<br />
Union Street.<br />
Document a set <strong>of</strong> guidelines for <strong>City</strong> managers to use as a framework for determining<br />
when to initiate sandbag distribution.<br />
Provide guidance on the <strong>City</strong> Web page for residents outside <strong>of</strong> the distribution areas that<br />
they may need to make their own provisions for sandbag procurement.<br />
Modify the <strong>City</strong>’s Web page search tool so that the <strong>Flood</strong>ing Information page can be<br />
accessed using the search feature on the <strong>City</strong>’s Web page.<br />
7.9 ADDITIONAL RECOMMENDATIONS<br />
The preceding sections summarize flood mitigation measure recommendations for the ten flood<br />
mitigation measures that were selected for detailed evaluation. Within the original<br />
comprehensive list <strong>of</strong> 27 potential mitigation measures, several potential measures provide flood<br />
benefits, but didn’t score high enough to warrant further assessment. However, some <strong>of</strong> these<br />
measures merit consideration for implementation. For the most part, these measures are not large<br />
structural projects. Further information and specific recommendations for the following<br />
measures are provided in Appendix C.<br />
Improve flapgate operation at outflow points<br />
Add backflow preventers in homes to prevent stormwater and sewer backups<br />
Isolate gas and electrical service lines<br />
Relocate external electrical boxes<br />
Inform businesses and residents about NFIP contents coverage<br />
Improve/enhance existing business identification system<br />
Provide updated information to residents<br />
28-JUL-10\\ 7-14
Provide education to area media outlets<br />
7.10 POTENTIAL FEDERAL FUNDING OPTIONS<br />
Recommendations<br />
A number <strong>of</strong> the flood mitigation activities recommended in this study carry significant capital<br />
improvement costs and operation and maintenance expenditures. Opportunities exist for the <strong>City</strong><br />
to pursue Federal Government grants to supplement <strong>City</strong> funding for implementation <strong>of</strong><br />
mitigation measures. An overview <strong>of</strong> FEMA grant programs is provided below. A more<br />
detailed discussion regarding funding options and federal grants is provided in Appendix L.<br />
FEMA’s Hazard <strong>Mitigation</strong> Assistance (HMA) program includes five individual grant programs<br />
that can be used for flood mitigation projects including:<br />
Hazard <strong>Mitigation</strong> Grant Program (HMGP)<br />
Pre-Disaster <strong>Mitigation</strong> (PDM)<br />
<strong>Flood</strong> <strong>Mitigation</strong> Assistance (FMA)<br />
Repetitive <strong>Flood</strong> Claims (RFC)<br />
Severe Repetitive Loss (SRL)<br />
While the HMA grant programs are administered by FEMA, an individual community must<br />
apply for these grants through its State government. The Virginia Department <strong>of</strong> Emergency<br />
Management is responsible for this process for the Commonwealth <strong>of</strong> Virginia. The (VDEM)<br />
Web site provides guidance on the application process for HMA grant opportunities. (Web site:<br />
http://www.vaemergency.com/grants/index.cfm )<br />
The PDM, FMA, REC, and SRL grant programs are not disaster specific and are subject to the<br />
availability <strong>of</strong> appropriation funding. HMGP grants are only available after a major disaster<br />
declaration in the State or Commonwealth; however, the focus <strong>of</strong> the grant application can be<br />
unrelated to the disaster that caused the declaration. FEMA posts disaster declarations on its Web<br />
site: http://www.fema.gov/news/disasters.fema. Typically a major disaster declaration is active<br />
for 12 months. The <strong>City</strong> <strong>of</strong> <strong>Alexandria</strong> may submit grant applications to FEMA through VDEM.<br />
VDEM has internal deadlines for the acceptance <strong>of</strong> grant applications. As <strong>of</strong> July 2010, it<br />
appears that VDEM is not currently accepting HMGP applications.<br />
7.11 CONCLUSIONS<br />
This report provides detailed information on potential flood mitigation measures for the <strong>Potomac</strong><br />
River waterfront area. Rather than a single flood mitigation solution, a series <strong>of</strong> measures are<br />
recommended to provide protection against flood events on the <strong>Potomac</strong> River. These measures<br />
require significant capital expense and cooperation from private property owners. In addition, it<br />
will take significant effort to comply with applicable regulations. However, proceeding with<br />
implementation <strong>of</strong> the recommended flood mitigation measures is essential to reduce the<br />
extensive flood damages in the <strong>City</strong>.<br />
28-JUL-10\\ 7-15
SECTION EIGHT: REFERENCES<br />
Access Floor Systems, 2009. Access Floor Systems. Accessed August 2009.<br />
http://www.accessfloorsystems.com/access/costs/?access=/qq/quickQuote.php.<br />
Appraiser Universe, 2009. Appraiser Universe. Accessed June 2009.<br />
http://www.appraiseruniverse.com/listing.php?id=11.<br />
Babbit, Christopher et al., 2008. Kingston, MA: RSMeans Company, Inc.<br />
Bankrate.com, 2009. “Closing cost averages: Virginia.”, Accessed June 2009.<br />
http://www.bankrate.com/brm/news/mortgages/2008/closing_costs_VA.asp.<br />
References<br />
Bankrate.com, 2009. “Mortgage closing costs: State rankings.” Accessed June 2009.<br />
http://www.bankrate.com/finance/exclusives/mortgage-closing-costs-state-rankings8-<br />
29952.aspx.<br />
Black & Veatch, 2006. South Florida Water Management District- EAA Reservoir A-1 Basis <strong>of</strong><br />
Design Report, Appendix 13-2: Mechanical Layout Alternatives Evaluation Technical<br />
Memorandum. Accessed September 2009.<br />
http://xlr8.sfwmd.gov/portal/page/portal/pg_grp_acceler8/pg_acceler8_projects_eaares/b<br />
odr_draft_eaares/appendices/appendix%2013-02.pdf<br />
Bryan Fryklund, Personal communication, removable floodwall cost estimate. <strong>Flood</strong> Control<br />
America. Sudbury, MA.<br />
Buck Schuckman, 2009. Personal communication, commercial window replacement cost<br />
estimate. September 30, 2009. Fairfax Glass Company. Falls Church, VA.<br />
<strong>City</strong> <strong>of</strong> <strong>Alexandria</strong>, 1992. The Zoning Ordinance <strong>of</strong> the <strong>City</strong> <strong>of</strong> <strong>Alexandria</strong>. Virginia Section 11-<br />
411: Archaeology Protection. Accessed September 2009.<br />
http://oha.alexandriava.gov/archaeology/ar-preservation-apc.html accessed.<br />
<strong>City</strong> <strong>of</strong> <strong>Alexandria</strong> (VA), 2004a. Final Natural Intermittent Stream Channel 50-Foot Buffer Map.<br />
June 2004.<br />
<strong>City</strong> <strong>of</strong> <strong>Alexandria</strong> (VA), 2004b. Resource Protection Area Buffer Map, Adopted by <strong>City</strong><br />
Council on June 12, 2004.<br />
<strong>City</strong> <strong>of</strong> <strong>Alexandria</strong> (VA), 2006a. Amendments to <strong>City</strong> <strong>of</strong> <strong>Alexandria</strong> Article XIII Environmental<br />
Management Ordinance. April 2006.<br />
http://alexandriava.gov/uploadedFiles/tes/info/Article_XIII_2006.pdf .<br />
<strong>City</strong> <strong>of</strong> <strong>Alexandria</strong> (VA), 2006b. Guide to the Old and Historic <strong>Alexandria</strong> and Parker-Gray<br />
Historic Districts. Department <strong>of</strong> Planning and Zoning.<br />
http://alexandriava.gov/uploadedFiles/planning/info/pnz_historic_districts_guide.pdf.<br />
<strong>City</strong> <strong>of</strong> <strong>Alexandria</strong> (VA), 2009a. Real Estate Assessment Search. Accessed July 2009.<br />
http://realestate.alexandriava.gov/.<br />
<strong>City</strong> <strong>of</strong> <strong>Alexandria</strong> (VA), 2009b. The Zoning Ordinance <strong>of</strong> the <strong>City</strong> <strong>of</strong> <strong>Alexandria</strong>. Department <strong>of</strong><br />
Planning and Zoning. Accessed September 2009.<br />
http://www.municode.com/Resources/gateway.asp?pid=12429&sid=46.<br />
28-JUL-10\\ 8-1
References<br />
<strong>City</strong> <strong>of</strong> <strong>Alexandria</strong> (VA), 2009c. The Zoning Ordinance <strong>of</strong> the <strong>City</strong> <strong>of</strong> <strong>Alexandria</strong>. Article XI.<br />
Development Approvals and Procedures. Division B. Development Approvals. Section<br />
11-411 Archaeology Protection (1992). Department <strong>of</strong> Planning and Zoning. Accessed<br />
September 2009.<br />
http://oha.alexandriava.gov/archaeology/ar-preservation-apc.html.<br />
CNN Money, 2009. “Who needs a property survey?” Accessed June 2009.<br />
http://money.cnn.com/2006/05/23/real_estate/who_needs_a_survey/index.htm.<br />
Commercial Property Appraisal, 2009. Commercial Property Appraisal. Accessed June 2009.<br />
http://www.commercialpropertyappraisal.com/index2.php.<br />
Danny Kim, 2009. Personal communication, commercial window replacement cost estimate.<br />
American Housing Contractor (Marvin Windows). September 30, 2009. Fairfax, VA.<br />
DoorDam, 2009. Product Pr<strong>of</strong>ile. Accessed July 2009. http://www.doordam.com/.<br />
Fairfax County, 2009. Levee and pumping station plans search. Department <strong>of</strong> Public Works and<br />
Environmental Services. Accessed September 2009.<br />
http://www.fairfaxcounty.gov/dpwes/publications/stormwater/huntingtonfinal_ch7.pdf.<br />
Federal Emergency Management Agency (FEMA), 1985a. District <strong>of</strong> Columbia <strong>Flood</strong> Insurance<br />
<strong>Study</strong>. November 1985.<br />
Federal Emergency Management Agency (FEMA), 1985b. <strong>Flood</strong>pro<strong>of</strong>ing Non-Residential<br />
Structures, FEMA 102. 1985.<br />
Federal Emergency Management Agency (FEMA), 1998a. Homeowner’s Guide to Retr<strong>of</strong>itting:<br />
Six Ways to Protect Your House from <strong>Flood</strong>ing, FEMA 312. June 1998.<br />
Federal Emergency Management Agency (FEMA), 1998b. Property Acquisition Handbook for<br />
Local Communities, FEMA 317.<br />
http://www.fema.gov/government/grant/resources/acqhandbook.shtm.<br />
Federal Emergency Management Agency (FEMA), 2001. Engineering Principles <strong>of</strong> Retr<strong>of</strong>itting<br />
<strong>Flood</strong>-Prone Residential Structures. June 2001.<br />
Federal Emergency Management Agency (FEMA), 2002. CRS Coordinators Manual.<br />
Federal Emergency Management Agency (FEMA), 2007. Selecting Appropriate <strong>Mitigation</strong><br />
Measures for <strong>Flood</strong>prone Structures, FEMA 551. March 2007.<br />
Federal Emergency Management Agency (FEMA), 2008. <strong>Flood</strong> Damage-Resistant Materials<br />
Requirements (Technical Bulletin 2), August 2008.<br />
Federal Emergency Management Agency (FEMA), 2009. FEMA Benefit-Cost Analysis Reengineering<br />
(BCAR), <strong>Flood</strong> Full Data Module Methodology Report, Version 4.5. May<br />
2009.<br />
Federal Emergency Management Agency (FEMA), DATE. “Benefit-Cost Analysis Resource<br />
Kit,” version 4.5. http://www.bchelpline.com/BCAToolkit/resources_flood.html<br />
<strong>Flood</strong>Guard UK Ltd, 2009. Company Web site. Accessed July 2009.<br />
http://www.floodguarduk.co.uk/en-us/front.html.<br />
28-JUL-10\\ 8-2
References<br />
Huber Technology, 2009. “<strong>Flood</strong>-pro<strong>of</strong> Door TT6.” Accessed July 2009.<br />
http://www.huber.de/products/stainless-steel-equipment/technical-doors/flood-pro<strong>of</strong>door.html.<br />
State <strong>of</strong> Maryland Department <strong>of</strong> Transportation, 2009. 6-21-02. “Type B Retaining Wall<br />
Section (For Good Soil Condition and Two Foot Surcharge).” State Highway<br />
Administration. Accessed September 2009.<br />
http://www.sha.state.md.us/businesswithsha/bizStdsSpecs/obd/BridgeStandards/Bridge_S<br />
tandards/15_Retaining-Walls2678/PDF/RW135_1.pdf<br />
Mon-Ray Inc, 2009. “About Our Area <strong>of</strong> Focus.” Accessed September 2009.<br />
http://www.monray.com/focus.htm#historic.<br />
National Oceanic and Atmospheric Administration, 2009. Tides and Currents -Tide Data for<br />
Station ID: 8594900. Accessed June 2009.<br />
http://tidesandcurrents.noaa.gov/data_menu.shtml?stn=8594900%20Washington,%20DC<br />
&type=Tide%20Data<br />
National Oceanic and Atmospheric Administration, 2009. “Point Precipitation Frequency<br />
Estimates From NOAA Atlas 14.” Accessed July 2009. http://hdsc.nws.noaa.gov/cgibin/hdsc/buildout.perl?type=pf&units=us&series=pd&statename=VIRGINIA&stateabv=<br />
va&study=orb&season=All&intype=3&plat=&plon=&liststation=0&slat=38.8088&slon<br />
=-77.06364&mlat=41.070&mlon=-74.988<br />
Nick Kalivretenos, 2009. Personal communication, commercial window replacement and storm<br />
window cost estimate. The Window Man. September 30, 2009. <strong>Alexandria</strong>, VA.<br />
Reade Advanced Materials, 2009. “Weight Per Cubic Food And Specific Gravity.” Accessed<br />
September 2009. http://www.reade.com/Particle_Briefings/spec_gra2.html<br />
Spencer, Eugene R. et al., 2003. RSMeans 2004: Site Work & Landscape Cost Data, eds.<br />
Barbara Balboni et al. Kingston, MA: Reed Construction Data.<br />
Spencer, Eugene R. et al., RSMeans 2009: Heavy Construction Cost Data. Kingston, MA: Reed<br />
Construction Data.<br />
U.S. Army Corps <strong>of</strong> Engineers (USACE), 2009. Water Resource Policies and Authorities<br />
Incorporating Sea-Level Change Considerations in Civil Work Programs. July 1, 2009.<br />
U.S. Army Corps <strong>of</strong> Engineers (USACE), 2009. Huntington <strong>Flood</strong> Damage Reduction <strong>Study</strong>,<br />
Fairfax County, Virginia. April 2009.<br />
http://www.fairfaxcounty.gov/dpwes/publications/stormwater/huntingtonfinal_ch7.pdf.<br />
U.S. Army Corps <strong>of</strong> Engineers (USACE), 2009. <strong>Flood</strong> Pro<strong>of</strong>ing Measures. Accessed July 2009.<br />
https://www.nwo.usace.army.mil/nfpc/fphow/ace8_05.htm.<br />
U.S. Census, 2009. Sales Data for <strong>Alexandria</strong> <strong>City</strong>.<br />
http://factfinder.census.gov/servlet/FindEconDatasetsServlet?_caller=geoselect&_ts=272<br />
967959021.<br />
U.S. Department <strong>of</strong> Transportation, 2009. Best Practices Design Guide for Designing Sidewalks<br />
and Trails for Access Search. Federal Highway Administration. Accessed September<br />
2009. http://www.fhwa.dot.gov/environment/sidewalk2/pdf.htm.<br />
28-JUL-10\\ 8-3
References<br />
U.S. Department <strong>of</strong> Labor, 2009. “Inflation Calculator: Bureau <strong>of</strong> Labor Statistics.” Accessed<br />
July 2009, http://www.bls.gov/bls/inflation.htm.<br />
Virginia Department <strong>of</strong> Historic Resources, 2003. Guidelines for Conducting Cultural Resource<br />
Survey in Virginia (2003), Accessed September 2009.<br />
http://www.dhr.virginia.gov/review/Survey_Manual_Web.pdf.<br />
Virginia Department <strong>of</strong> Conservation and Recreation, 1999. Virginia Stormwater Management<br />
Handbook, Volume 2, First Edition. Accessed September 2009.<br />
http://www.dcr.virginia.gov/soil_and_water/documents/Chapter_4.pdf.<br />
Virginia Department <strong>of</strong> Transportation, 2009. Road and Bridge Standards. Retaining wall<br />
drawings search. Accessed September 2009.<br />
http://www.extranet.vdot.state.va.us/LocDes/Electronic%20Pubs/Standards/TOC400.pdf.<br />
Zimbio Money, 2009. “Purchaser's Closing Costs in Virginia.” Accessed June 2009.<br />
http://www.zimbio.com/Real+Estate/articles/414/Purchaser+Closing+Costs+Virginia.<br />
28-JUL-10\\ 8-4
Appendix A<br />
Initial Ranking <strong>of</strong> Potential <strong>Flood</strong> <strong>Mitigation</strong> Solutions
<strong>Potomac</strong> River <strong>Waterfront</strong> <strong>Flood</strong> <strong>Mitigation</strong> <strong>Study</strong><br />
Ranking <strong>of</strong> Potential <strong>Flood</strong> <strong>Mitigation</strong> Solutions<br />
TOTAL SCORE<br />
Rep Loss Property<br />
Mitigated<br />
State/Federal Funding<br />
Regulatory Requirements<br />
Private Property Acquisition<br />
Historical/Archeological<br />
Resources<br />
<strong>Potomac</strong> River View Shed<br />
Loss <strong>of</strong> Recreational Use<br />
Loss <strong>of</strong> Business Revenue<br />
Reduces <strong>Flood</strong>ing Extent<br />
Reduces <strong>Flood</strong> Damages<br />
Long Term and<br />
Maintenance Costs<br />
Extent <strong>of</strong> <strong>Flood</strong> Protection<br />
General Environmental<br />
Impacts<br />
Level <strong>of</strong> Protection for<br />
Extreme <strong>Flood</strong>ing<br />
Level <strong>of</strong> Protection for<br />
Nuisance <strong>Flood</strong>ing<br />
Property Ownership<br />
<strong>City</strong> Liability<br />
Cost to Property Owners<br />
Cost <strong>of</strong> <strong>Flood</strong> Insurance<br />
Constructability<br />
Cost Considerations<br />
Criteria Number --> 1 2 3 4 5 6 7 8 9 10 11 12 13 14 15 16 17 18 19 20 21 22<br />
Weighting Factor --> 3 3 3 1 5 3 1 1 5 10 10 3 5 5 5 1 3 1 3 1 1 3<br />
1 PP1 5 5 5 5 5 5 5 10 1 5 2 5 10 1 5 5 5 5 10 10 5 1 348 11<br />
2 PP2 1 5 5 10 5 5 5 10 5 5 2 10 10 1 10 5 5 5 10 5 5 1 396 7<br />
3 PP3 5 10 10 5 10 5 5 10 1 5 2 5 5 1 5 5 5 10 10 10 1 1 379 9<br />
4 PP4 5 5 5 5 10 5 10 10 1 1 1 10 10 1 1 5 5 10 10 10 1 1 324 14<br />
5 PP5 5 1 5 10 1 10 1 10 10 10 2 10 10 1 10 5 10 5 1 1 5 10 473 3<br />
6 PP6 1 5 1 10 1 5 1 10 10 10 2 10 10 1 10 5 5 5 10 5 5 1 435 6<br />
7 S1 1 1 1 10 10 1 5 5 10 5 10 1 10 10 10 5 1 1 5 1 10 10 500 1<br />
8 S2 5 1 1 10 10 1 5 5 10 5 10 1 10 5 10 5 5 1 5 1 10 10 499 2<br />
9 S3 5 1 1 5 10 5 7 10 1 10 5 5 10 1 5 5 5 10 10 5 1 5 439 5<br />
10 S4 5 5 1 5 10 5 7 10 1 1 1 1 5 1 1 5 5 10 10 5 1 1 252 24<br />
11 S5 5 5 5 5 10 5 7 10 1 1 1 1 1 1 1 5 5 10 10 5 1 1 244 25<br />
12 S6 5 5 5 5 10 5 7 10 1 5 5 1 1 5 5 5 5 10 10 5 1 5 376 10<br />
13 S7 5 5 5 5 10 5 7 10 1 1 2 1 1 1 1 5 5 10 10 5 1 1 254 23<br />
14 S8 5 1 1 5 10 5 7 10 1 1 1 5 1 1 1 5 5 5 10 5 1 1 227 27<br />
15 S9 1 1 1 5 10 5 7 5 1 1 1 5 1 1 1 5 5 5 10 5 1 1 210 28<br />
16 S10 5 1 5 5 10 5 10 5 1 1 1 5 1 1 1 5 5 10 10 5 1 1 242 26<br />
17 PR1 5 10 5 5 5 5 5 10 1 5 1 10 5 1 5 5 5 10 10 5 1 1 339 12<br />
18 PR2 5 10 10 10 10 5 10 10 5 5 1 10 5 1 1 5 5 10 10 5 1 1 389 8<br />
19 ES1 5 5 10 5 10 5 10 10 1 1 1 10 1 1 10 5 5 10 10 5 1 1 334 13<br />
20 ES2 5 5 10 5 10 5 10 10 1 1 1 5 1 1 5 5 5 10 10 10 5 1 303 18<br />
21 ES3 5 5 10 5 10 5 10 10 1 1 1 5 1 1 5 5 5 10 10 10 5 1 303 18<br />
22 ES4 5 5 10 5 10 5 10 10 1 1 1 10 1 1 5 5 5 10 10 10 10 1 323 15<br />
23 ES5 5 5 10 5 10 5 10 10 1 5 5 5 5 1 10 5 5 10 10 10 1 15 466 4<br />
24 ES6 5 5 10 5 10 5 10 10 1 1 1 5 1 1 5 5 5 10 10 10 1 1 299 20<br />
25 EA1 5 10 10 5 10 5 10 10 1 1 1 5 1 1 1 5 5 10 10 10 1 1 294 21<br />
26 EA2 5 5 5 5 10 5 10 10 1 1 1 10 1 1 1 5 5 10 10 10 1 1 279 22<br />
27 EA3 5 10 10 5 10 5 10 10 1 1 1 10 1 1 1 5 5 10 10 10 1 1 309 16<br />
28 Do Nothing 5 10 10 5 10 5 10 10 1 1 1 10 1 1 1 5 5 10 10 10 1 1 309 16<br />
RANK<br />
Criteria --> Aesthetics
Appendix B<br />
Ordinance and Sandbag Information
Exhibit 1-1. Sample ordinance from the <strong>City</strong> <strong>of</strong> Charlotte, Mecklenburg County, NC<br />
regarding permitting for new construction and improvements and construction<br />
inspection.<br />
1
Exhibit 1-2. Sample ordinance from Charlotte, Mecklenburg County, NC regarding<br />
accessory structures.<br />
Exhibit 1-3. Sample ordinance from Roseville, CA regarding variances.<br />
9.80.300 Nature <strong>of</strong> variances.<br />
The variance criteria set forth in this section are based on the<br />
general principle <strong>of</strong> zoning law that variances pertain to a piece <strong>of</strong><br />
property and are not personal in nature. A properly issued variance is<br />
granted for a parcel <strong>of</strong> property with physical characteristics so unusual<br />
that complying with the requirements <strong>of</strong> this chapter would create an<br />
2
exceptional hardship to the applicant or the surrounding property owners.<br />
The characteristics must be unique to the property and not be shared by<br />
adjacent parcels. The unique characteristic must pertain to the land itself,<br />
not to the structure, its inhabitants, or the property owners.<br />
It is the duty <strong>of</strong> the city to help protect its citizens from flooding.<br />
This need is so compelling, and the implications <strong>of</strong> the cost <strong>of</strong> insuring a<br />
structure built below flood level are so serious that variances from the<br />
flood elevation or from other requirements in the flood chapter are quite<br />
rare. Therefore, the variance guidelines provided in this chapter are more<br />
detailed and contain multiple provisions that must be met before a<br />
variance can be properly granted. The criteria are designed to screen out<br />
those situations in which alternatives other than a variance are more<br />
appropriate. (Ord. 3066 § 1 (part), 1997: Ord. 2374 § 1 (part), 1990.)<br />
9.80.310 Variance procedure.<br />
A. The city council <strong>of</strong> the <strong>City</strong> <strong>of</strong> Roseville shall hear and<br />
decide appeals and requests for variances from the requirements <strong>of</strong> this<br />
chapter. Applications for a variance shall be made in the usual manner<br />
provided for Zoning Ordinance variances and shall include the standard<br />
variance application fee.<br />
B. The city council shall hear and decide appeals when it is<br />
alleged there is an error in any requirement, decision, or determination<br />
made by the floodplain administrator in the enforcement or administration<br />
<strong>of</strong> this chapter.<br />
C. In passing upon such applications, the city council shall<br />
consider all technical evaluations, all relevant factors, standards specified<br />
in other sections <strong>of</strong> this chapter, and:<br />
1. The danger that materials may be swept onto other lands to<br />
the injury <strong>of</strong> others;<br />
2. The danger <strong>of</strong> life and property due to flooding or erosion<br />
damage;<br />
3. The susceptibility <strong>of</strong> the proposed facility and its contents<br />
to flood damage and the effect <strong>of</strong> such damage on the existing individual<br />
owner and future owners <strong>of</strong> the property;<br />
4. The importance <strong>of</strong> the services provided by the proposed<br />
facility to the community;<br />
3
5. The necessity to the facility <strong>of</strong> a waterfront location, where<br />
applicable;<br />
6. The availability <strong>of</strong> alternative locations for the proposed<br />
use which are not subject to flooding or erosion damage;<br />
7. The compatibility <strong>of</strong> the proposed use with existing and<br />
anticipated development;<br />
8. The relationship <strong>of</strong> the proposed use to the comprehensive<br />
plan and floodplain management program for that area;<br />
9. The safety <strong>of</strong> access to the property in time <strong>of</strong> flood for<br />
ordinary and emergency vehicles;<br />
10. The expected heights, velocity, duration, rate <strong>of</strong> rise, and<br />
sediment transport <strong>of</strong> the flood waters expected at the site; and,<br />
11. The costs <strong>of</strong> providing governmental services during and<br />
after flood conditions, including maintenance and repair <strong>of</strong> public utilities<br />
and facilities such as sewer, gas, electrical, and water systems, and streets<br />
and bridges.<br />
D. Any applicant to whom a variance is granted shall be given<br />
written notice over the signature <strong>of</strong> a community <strong>of</strong>ficial that (1) the<br />
issuance <strong>of</strong> a variance to construct a structure below the base flood level<br />
will result in increased premium rates for flood insurance up to amounts as<br />
high as $25.00 for $100.00 <strong>of</strong> insurance coverage and (2) such<br />
construction below the base flood level increases risks to life and property.<br />
A copy <strong>of</strong> the notice shall be recorded by the floodplain board in the <strong>of</strong>fice<br />
<strong>of</strong> the Placer County recorder and shall be recorded in a manner so that it<br />
appears in the chain <strong>of</strong> title <strong>of</strong> the affected parcel <strong>of</strong> land.<br />
E. The floodplain administrator will maintain a record <strong>of</strong> all<br />
variance actions, including justification for their issuance, and report such<br />
variances issued in its biennial report submitted to the Federal Insurance<br />
Administration, Federal Emergency Management Agency. (Ord. 3066 § 1<br />
(part), 1997: Ord. 2374 § 1 (part), 1990.)<br />
9.80.320 Conditions for variances.<br />
A. Generally, variances may be issued by the city council for<br />
new construction, substantial improvement and other proposed new<br />
development to be erected on a lot <strong>of</strong> one-half acre or less in size<br />
contiguous to and surrounded by lots with existing structures constructed<br />
below the base flood level, providing that the procedures <strong>of</strong> Sections<br />
4
9.80.130 through 9.80.150, inclusive, have been fully considered. As the<br />
lot size increases beyond one-half acre, the technical justification required<br />
for issuing the variance increases.<br />
B. Variances may be issued for the repair or rehabilitation <strong>of</strong><br />
“historic structures” upon a determination that the proposed repair or<br />
rehabilitation will not preclude the structure’s continued designation as a<br />
historic structure and the variance is the minimum necessary to preserve<br />
the historic character and design <strong>of</strong> the structure.<br />
C. Variances shall not be issued within any designated<br />
floodway if any increase in flood levels during the base flood discharge<br />
would result.<br />
D. Variances shall only be issued upon a determination that<br />
the variance is the “minimum necessary,” considering the flood hazard, to<br />
afford relief.<br />
E. Variances shall only be issued upon (1) a showing <strong>of</strong> good<br />
and sufficient cause; (2) a determination that failure to grant the variance<br />
would result in exceptional “hardship” to the applicant; and (3) a<br />
determination that the granting <strong>of</strong> a variance will not result in increased<br />
flood heights, additional threats to public safety, extraordinary public<br />
expense, create “nuisances” cause “fraud or victimization” <strong>of</strong> the public,<br />
or conflict with existing local laws or ordinances.<br />
F. Variances may be issued for new construction, substantial<br />
improvement and other proposed new development necessary for the<br />
conduct <strong>of</strong> a functionally dependent use provided that the provisions <strong>of</strong><br />
Sections 9.80.320(A)—(E) are satisfied and that the structure or other<br />
development is protected by methods that minimize flood damages during<br />
the base flood and create no additional threats to public safety.<br />
G. Upon consideration <strong>of</strong> the factors <strong>of</strong> Section 9.80.310(C)<br />
and the purposes <strong>of</strong> this chapter, the city council may attach such<br />
conditions to the granting <strong>of</strong> variances as it deems necessary to further the<br />
purposes <strong>of</strong> this chapter. The decision <strong>of</strong> the city council shall be final.<br />
(Ord. 3066 § 1 (part), 1997: Ord. 2374 § 1 (part), 1990.)<br />
5
Appendix C<br />
Non-Prioritized Measures
As explained in Section 3.3 <strong>of</strong> the report, these mitigation measures were not in the top<br />
9 rated measures for the study, but since they are inexpensive and may be easy to<br />
implement, the information is being provided for the <strong>City</strong>.<br />
Improve flap gate operation at outflow points<br />
There are two locations in the study area where the manholes and inlets are lower than<br />
4 feet, which is the defined nuisance flooding elevation. With a 4-foot tide, it is possible<br />
that the tide waters could back up the drain pipes and flood the area surrounding these<br />
low manholes and inlets. Increasing the inlet and road elevations is addressed in<br />
Section 6.4.<br />
This mitigation solution addresses a different aspect <strong>of</strong> this problem - the flap gates at the<br />
outflow points. During high tides, the existing flap gates at the outflow points in the<br />
<strong>Potomac</strong> River should close to prevent tidewater from backing up the stormwater pipes.<br />
A September 26, 2007 conversation with Roy Worell and George Guiseppe in the <strong>City</strong> <strong>of</strong><br />
<strong>Alexandria</strong> Maintenance Department indicated that the <strong>City</strong> already has a program to<br />
clean the flap gate areas prior to storm events, but storm flows bring debris though the<br />
system which blocks the flap gates again.<br />
To address this problem, we suggest switching from standard flap gates to duckbill check<br />
valves at the King Street and Prince Street outfall locations. A conversation with Lalit<br />
Sharma <strong>of</strong> the <strong>City</strong> <strong>of</strong> <strong>Alexandria</strong> Department <strong>of</strong> Environmental Quality said that the <strong>City</strong><br />
once tried a duckbill type <strong>of</strong> check valve, but it didn’t appear to work properly. He<br />
concluded that the problem was not with the duckbill check valve but was probably<br />
caused by an improperly sized valve.<br />
Duckbill check valves have many advantages: they don’t rust and greatly reduce<br />
clogging. Additionally, they only need as little as 1 inch <strong>of</strong> head water to allow<br />
stormwater outflow. The data from the <strong>City</strong>’s GIS layers show that a 21-inch diameter<br />
duckbill check valve would be needed at the King St outfall and a 24-inch diameter<br />
duckbill valve would be needed at the Prince St outfall. These check valves cost around<br />
$5,500 plus installation. The benefits <strong>of</strong> this would be a reduction in maintenance costs<br />
and a reduction in nuisance flooding in the downtown area from water backing up the<br />
storm sewers.<br />
1
Figure 1: Duckbill Check Valve<br />
A typical duckbill check valve is shown in Figure 1 in the open and closed positions.<br />
Add backflow preventers to prevent stormwater and sewer backups.<br />
There has been one reported case <strong>of</strong> internal flooding caused by sewer backup at a<br />
residence at the intersection <strong>of</strong> Royal and Pendleton Streets. This location is not in the<br />
study area, but is near the northwest border <strong>of</strong> the study area. There are combined sewers<br />
running through a portion <strong>of</strong> the study area along Pendleton, Union, South Royal, and<br />
South Pitt Streets. Along theses locations, there is the possibility for flooding caused by<br />
sewer backups.<br />
Adding backflow preventers to homes is an easy way to prevent this type <strong>of</strong> internal<br />
flooding. The <strong>City</strong> <strong>of</strong> <strong>Alexandria</strong> sponsored a program in 2006 in the Commonwealth<br />
area <strong>of</strong> the <strong>City</strong> outside this study area to provide some financial assistance to residents<br />
who chose to install backflow preventers. The program mailed brochures about this<br />
program to residents and received many calls asking about more details. Only 20<br />
residents applied for and received financial assistance from the <strong>City</strong>. The backflow<br />
preventers have been effective and all residents who installed them have reported no<br />
further problems.<br />
We recommend that the <strong>City</strong> revise and reissue the brochures to focus on and around the<br />
study area and <strong>of</strong>fer assistance to residents along Pendleton, Union, South Royal, and<br />
South Pitt Streets. The residents could contract any capable plumber to undertake the<br />
work, and the <strong>City</strong> may consider reimbursing the residents for a portion <strong>of</strong> the cost. In the<br />
2006 program, the <strong>City</strong> <strong>of</strong>fered residents up to $500 towards the cost <strong>of</strong> the backflow<br />
preventer and the labor to install it.<br />
Since the brochures are essentially prepared and there is a staff member familiar with the<br />
program, the costs to implement this measure will be minimal. The costs will be to mail<br />
the brochures to an estimated 150 buildings as well as setting aside money to <strong>of</strong>fer to<br />
residents. In the previous program, approximately $10,000 was given to <strong>City</strong> residents to<br />
2
help defray the cost <strong>of</strong> the installation. Residents would have to contribute some <strong>of</strong> their<br />
own money as well, but would receive the benefits <strong>of</strong> avoiding future sewer backups.<br />
Isolate gas and electrical services<br />
Returning power and gas to homes and businesses affected by flooding is a top priority<br />
for both Washington Gas and Dominion Power.<br />
Washington Gas has several main valves which provide gas to residents and businesses<br />
within the waterfront area <strong>of</strong> the <strong>City</strong>. Once water enters a structure the main valve line<br />
will be turned <strong>of</strong>f which could affect other buildings. Washington.Gas has been working<br />
to isolate as many lines as possible by adding isolation valves. They have also been<br />
raising meters and vent lines in low lying areas.<br />
It is in Washington Gas’s best interest to isolate as many structures as possible since<br />
before the main valve can be turned back on, the meters/valves at each structure must be<br />
turned on and gas lights must be relit by the Gas Company for safety purposes. This is a<br />
labor intensive job for their employees; and for residents and businesses in the area, this<br />
means that gas service is down until a company representative can visit every structure.<br />
Washington Gas has indicated that they have an extensive operations and management<br />
plan and can meet with the <strong>City</strong> if they want to discuss a particular line, although since<br />
Washington Gas is a private company, ultimately they decide which lines will be<br />
isolated.<br />
Dominion Power reports that there are no significant power issues due to flooding along<br />
the waterfront and that it is very rare for the power to be turned <strong>of</strong>f due to flooding. Most<br />
<strong>of</strong> the transformers in the waterfront area are on the ro<strong>of</strong> and those that are submersible<br />
are protected.<br />
The power is mainly affected during storm events that cause feeder issues due to wind<br />
and rain. If it is a small event, the Dominion Power will fix the issue as soon as possible.<br />
If a significant storm or hurricane is active or anticipated, the Emergency Operations<br />
Center <strong>of</strong> the Power Company is in constant contact with the <strong>City</strong> <strong>of</strong> <strong>Alexandria</strong><br />
Emergency Operations Center, usually the Fire Marshalls. It doesn’t happen <strong>of</strong>ten, but<br />
the Fire Marshalls could direct the Power Company to turn <strong>of</strong>f the power. When the<br />
power is knocked out, Dominion Power would first respond to the Critical Infrastructure<br />
and then to the largest areas without power.<br />
Dominion Power is always looking at improving the reliability <strong>of</strong> the system. They <strong>of</strong>ten<br />
perform maintenance on equipment and within the past few years, the underground<br />
cables at the Torpedo Factory were replaced. Although Dominion Power feels that there<br />
is not one specific area along the waterfront that has continuous power issues, they<br />
welcome future discussions with the <strong>City</strong> about their priorities.<br />
3
Relocate external electrical boxes<br />
Elevating external electrical boxes above extreme flooding elevations would help prevent<br />
electrical outages during storms. It could also help return power to the <strong>City</strong> more quickly<br />
after a storm since the electrical components <strong>of</strong> that particular building would not have to<br />
be checked.<br />
<strong>City</strong> residents and businesses would be responsible for contracting a licensed electrician<br />
to move these components, but the <strong>City</strong> could help in several ways. They could publish a<br />
brochure or have information about floodpro<strong>of</strong>ing utility systems on the website under a<br />
proposed new section <strong>of</strong> the Emergency Preparedness page for <strong>Flood</strong>ing. If the <strong>City</strong><br />
wants to encourage residents to floodpro<strong>of</strong> their utility systems, the <strong>City</strong> might consider<br />
<strong>of</strong>fering financial help similar to the backflow preventer program described earlier in this<br />
document. Elevating internal outlets, light sockets, junction boxes, electric motors, and<br />
breakers or fuse boxes would also help with this goal.<br />
Additional information on floodpro<strong>of</strong>ing utility systems can be found in Appendix K,<br />
Exhibit 3.<br />
Inform businesses and residents about NFIP contents coverage<br />
Even a few inches <strong>of</strong> water can cause thousands <strong>of</strong> dollars in repair and restoration costs<br />
for homeowners and businesses. <strong>Flood</strong> insurance is “single peril” insurance, sold<br />
separately from homeowners insurance. <strong>Flood</strong> insurance protects against losses to<br />
buildings and their contents, but not the land surrounding them. The coverage applies<br />
whether the flooding results from heavy or prolonged rains, coastal storm surge, snow<br />
melt, blocked storm drainage systems, levee dam failure, or other causes. To be<br />
considered a flood, the waters must cover at least two acres or affect at least two<br />
properties.<br />
While many residents and businesses in the <strong>City</strong> <strong>of</strong> <strong>Alexandria</strong> are aware <strong>of</strong> and may<br />
have flood insurance for their buildings, they may not be aware <strong>of</strong> the availability <strong>of</strong><br />
contents insurance. Especially for businesses that are frequently affected by nuisance<br />
floods, obtaining contents insurance may help reduce the burden <strong>of</strong> flooding.<br />
The <strong>City</strong> could extend an outreach program to inform residents and businesses about<br />
flood insurance options. This information would be distributed through hand-outs,<br />
mailings, and the <strong>City</strong>’s website.<br />
This outreach program could be done at a minimal cost to the <strong>City</strong>. The <strong>City</strong> could<br />
develop a small brochure and add content to their website. There would be additional<br />
costs for the distribution <strong>of</strong> these materials. <strong>City</strong> residents and business owners could<br />
decide how to respond, but will hopefully would purchase contents insurance, which<br />
would reduce their liability after a flood.<br />
4
Improve/enhance existing business identification system<br />
There is currently no identification/badge (ID) system in place for the Old Town area <strong>of</strong><br />
<strong>Alexandria</strong> to facilitate quicker returns to residences and businesses after a flood. Right<br />
now, the business owners make a list <strong>of</strong> employees and give that to the people who are<br />
manning the check points; people on the list are then let through the check points.<br />
Since some business owners have expressed frustration with this system, a system that<br />
includes creation <strong>of</strong> permanent IDs could help people pass more quickly through check<br />
points. If the <strong>City</strong> does not already have a machine to make badges, it could invest from<br />
$1,000 to $2,500 dollars for a simple machine. Since employee turnover is high for some<br />
businesses, we do not suggest photo IDs. Rather, we suggest the <strong>City</strong> make several IDs<br />
for each business that list the business name and address. The <strong>City</strong> could allow the<br />
businesses a small number <strong>of</strong> free badges and charge for additional copies. The business<br />
owner will be responsible for distributing these to employees who can use them to get<br />
through the check points. For residents, a government issued ID with current address<br />
should be sufficient to pass through the check point.<br />
Provide Updated Information to Residents<br />
The <strong>City</strong> <strong>of</strong> <strong>Alexandria</strong> has developed a flood warning system for areas that are within<br />
the floodplain. Warnings are disseminated by local radio (WMAL-630 AM, WWRC-<br />
1260 AM, WTOP-103.5 FM, WKYS-93.9 FM), TV, weather radios, and by police<br />
equipped with public address systems. The flood warning system is intended to provide<br />
up to 0.5 hour advance warning <strong>of</strong> a flood hazard. The <strong>City</strong>’s website provides links to<br />
three USGS river gauges in the immediate region.<br />
Additionally, the Emergency Operations department receives weather forecasts from the<br />
National Weather Service. If a flood is impending, that group goes door-to-door in the<br />
study region to pass out flyers or leave them on the door. The flyers warn people about<br />
the impending flooding and let them know if sandbags will be available for pick up or if<br />
they will be dropped <strong>of</strong>f at the businesses.<br />
In other parts <strong>of</strong> the <strong>City</strong>, when flooding is expected they have a phone notification<br />
system in place. They use a GIS database with phone numbers coded in by address. A<br />
polygon <strong>of</strong> the expected extent <strong>of</strong> flooding is created and their program extracts all the<br />
numbers within that area and leaves a pre-recorded message about the flood event. This<br />
system is not currently used in the study areas as the precedence set is that the residents<br />
and business owners are visited by <strong>City</strong> workers. It is recommended that the phone<br />
notification system be used within the study area. This modification will save money and<br />
allow <strong>City</strong> workers to focus on other pre-flooding preparations.<br />
The <strong>City</strong> <strong>of</strong> <strong>Alexandria</strong> also has an eNews service that sends emails or text messages<br />
about the latest information regarding <strong>City</strong> services and emergency alerts. It is<br />
recommended that the <strong>City</strong> conduct outreach activities to encourage residents and<br />
business owners to sign up for this free service to receive flood warnings.<br />
5
Last, Hurricane Preparedness information is provided on the Emergency Preparedness<br />
section <strong>of</strong> the <strong>City</strong>’s website, but more flooding information could be easily added. For<br />
example, this site could include the latest news alerts and tide gage information. The cost<br />
to change the website is minimal.<br />
Provide Education to Area Media Outlets<br />
Businesses in the <strong>City</strong> <strong>of</strong> <strong>Alexandria</strong>, particularly in the Old Town area, report lost<br />
revenue from tourists due to the media hype over pending flooding. TV stations <strong>of</strong>ten<br />
find the picturesque backdrop perfect for their field reporters, who then report that<br />
flooding is imminent. While the <strong>City</strong> welcomes the media to use the town as a backdrop,<br />
they would like to see more accurate reporting.<br />
While it may seem like a struggle to limit the misreporting, the <strong>City</strong> can improve the way<br />
flood risks are communicated to the media and to the public. The following list gives<br />
several suggestions on how to provide accurate information to the media.<br />
Provide alternative ways for visitors and consumers to obtain information about<br />
the flood conditions by looking beyond traditional media (<strong>City</strong>’s web site or<br />
another web site with maps highlighting areas open and accessible to the public).<br />
Create an editorial board to help reporters and editors understand the issues.<br />
Create “new media” news releases that get distributed to print and broadcast<br />
media outlets that would give them the real story about the flooding. This could<br />
be set up through an RSS feed to push the stories to the outlets directly.<br />
Create a “media card” with information about who to contact for accurate and upto-date<br />
information about flooding conditions.<br />
Give the media something different to report. Innovative campaigns will catch<br />
their attention. Flashy signs will create interesting backdrops for reporters.<br />
6
Appendix D<br />
Data Collection
<strong>Potomac</strong> River <strong>Waterfront</strong> <strong>Flood</strong> <strong>Mitigation</strong> <strong>Study</strong><br />
Exhibit 1: Survey Data<br />
FID<br />
Number<br />
Buildings Address Description Landuse <strong>of</strong> Floors Z_ELEV<br />
76 211 N UNION ST Garage with Offices on top Commercial 4 3.7<br />
764 120-130 CAMERON ST Condos Residential 4 9.2<br />
767 110-120 CAMERON ST Condos Residential 4 4.6<br />
802 102-160 N UNION ST Residences At Torpedo Factory Residential 4 4.0<br />
819 211 STRAND ST Mystic Jewellers Commercial 1 6.0<br />
828 220 S UNION ST Art League Commercial 1 6.0<br />
905 115 S UNION ST Structure On Garage Commercial 2 4.1<br />
1398 100 CAMERON MW Cameron Mews Residential 3 4.0<br />
1404 104 S UNION ST The Virginia Shop Commercial 3 3.9<br />
1419 1 WALES AL Shops Commercial 4 2.2<br />
1465 115 N LEE ST Residences Of Torpedo Factory<br />
Condominium<br />
Residential 4 6.0<br />
1468 104 CAMERON MW Cameron Mews Residential 3 7.6<br />
1479 105 CAMERON MW Cameron Mews Residential 3 8.0<br />
1481 101 CAMERON MW Cameron Mews Residential 3 4.0<br />
1497 109 QUEEN ST Row house Residential 3 8.0<br />
1498 113 QUEEN ST Row house Residential 3 8.0<br />
1506 100 QUAY ST Row Houses With Garage /<br />
Appeared Split Level With A<br />
Walkdowm Living Space<br />
Residential 3 8.0<br />
1575 430 N UNION ST Row Houses With Garage Residential 3 8.0<br />
1577 426 N UNION ST Row Houses With Garage Residential 3 8.0<br />
1579 422 N UNION ST Row Houses With Garage Residential 3 8.8<br />
1584 412 N UNION ST Row Houses With Garage Residential 3 9.6<br />
1587 406 N UNION ST Row Houses With Garage Residential 3 9.7<br />
1590 400 N UNION ST Row Houses With Garage Residential 3 9.6<br />
1599 101 QUAY ST Row House With Garage Residential 3 8.9<br />
1600 100 PRINCESS ST Row Houses With Garage /<br />
Appeared Split Level With A<br />
Walkdowm Living Space<br />
Residential 3 9.5<br />
1636 221 N LEE ST Row Hourses On Parking Garage Residential &<br />
Commercial<br />
2 4.2<br />
1674 102 PRINCE ST Row House Residential 1 7.3<br />
1692 109 PRINCE ST Residential 2 9.0<br />
1697 215 S UNION ST The Carraige House C<strong>of</strong>fee Shop Commercial 2 8.1<br />
1699 204 S UNION ST Business Commercial 3 4.7<br />
1700 206 S UNION ST Business Commercial 3 5.7<br />
1938 830 S LEE ST Business Residential 2 9.9<br />
2017 827 S ROYAL ST Business Residential 1 12.4<br />
2038 201 KING ST Business Commercial 3 10.2<br />
0 409 S UNION ST Semi-Detached House Residential 1 10.4
Exhibit 2: Field Visit Summary – July 23, 2009<br />
All elevations noted in the field visit summary are referenced to NAVD88.<br />
Area No 1 – Structures along N Union Street between Oronoco St and Princess St<br />
All structures in this area are Residential, row houses with garages. All garages are<br />
approximately at the road elevation, which is about 8.0 ft. structures have 3-4 steps up to<br />
the door way (Refer figure A1-1). The lowest point <strong>of</strong> entry (LPE) for these structures is<br />
at the garage elevation. The first floor elevation appears to be lower than the LPE. Corner<br />
units (observed at Union and Princess Intersection) have side windows which show that<br />
these houses have living space lower than the garage elevation. (5 +/- ft) However it<br />
appears that the structures have split floors (3-4 floors), so when you enter the house<br />
through the main front door, there is a staircase leading upstairs to a living area and stairs<br />
leading downstairs. Downstairs probably there is an escape window lower than the<br />
elevation at the entrance; however the water might not be able to go around these<br />
structures, to the backyard. 430 N Union St appears to be abandoned.<br />
Figure A1-1<br />
Structures on Princess Street are most likely to follow the same trend but with 1 step up<br />
to the doorway. There appeared to be a jump in the first floor elevations at 113/115 and<br />
also at the 117/119 princess st. (Refer Figure A1-12)<br />
Page 1 <strong>of</strong> 18
Figure A1-12<br />
Exhibit 2: Field Visit Summary – July 23, 2009<br />
There are no existing flood control measures but the mitigation measures for this area<br />
should extend up to 121 Princess St. (structures West <strong>of</strong> this don’t have any flood<br />
problem as they are high enough).<br />
Area No 2 – Robinson Terminal<br />
This is a warehouse located at the Oronoco and Union Street intersection. Garage located<br />
at the ground level. They have 2 buildings with loading docks approximately 3.5 ft above<br />
the ground. (Refer figures A2-1 and A2-4) Both buildings have first floors located at the<br />
dock level, which appears to be at 12 ft and flooding is not a problem to these buildings.<br />
No major flood protection measures are required for these buildings, however acquire<br />
these buildings would provide great aesthetics, recreational and environmental benefits to<br />
the city.<br />
Figure A2-1 Figure A2-4<br />
Page 2 <strong>of</strong> 18
Exhibit 2: Field Visit Summary – July 23, 2009<br />
Area No 3 – Structures along N Union Street between Princess St and Quay St.<br />
All the structures have garages at the road elevation and the Lowest Point <strong>of</strong> Entry is at<br />
the garage level for most <strong>of</strong> these structures. Main door way is at the garage elevation or<br />
1-2 steps above the garage level. (Refer Figure A3-1)<br />
Figure A3-1 Figure A3-3<br />
These structures appeared to have a living area lower than garage elevation. (Appeared as<br />
split level with a walk down living space- Refer Figure A3-3, same as area 1)<br />
Based on the information from one <strong>of</strong> the residents (112 Princess St), this street has never<br />
been flooded.<br />
Once flood risk will be confirmed by surveyed elevations, flood pro<strong>of</strong>ing may be a<br />
suitable mitigation option for these properties, which may be removable household<br />
products, such as flood boards, air brick covers, which are fitted temporarily to individual<br />
properties to form a barrier to stop water coming in. Also should consider how the fabric<br />
<strong>of</strong> the walls, services, floors etc will respond to the pressure <strong>of</strong> the floodwater, including<br />
making walls more water resistant and repairing and sealing cracks.<br />
Area No 4: Structures along N Union between Quay and Queen Streets<br />
This area is similar to Area no 3. Some <strong>of</strong> the structures have garages and doors at ground<br />
elevation where as others have their door way 1 or 2 steps above the garage level. (Refer<br />
Figure A4-1) LPE for all the structures is at the garage level. Based on the information<br />
from one <strong>of</strong> the residents staying at 106 Quay Street, most <strong>of</strong> the structures have family<br />
room /living space below the garage level. (A window at the lower living space can be<br />
observed from figure A4-4).There was no flooding in this street during Isabel. It appears<br />
that the first floor elevations were taken at the door level for these structures. (Actual first<br />
floor starts below the garage elevation, which due to the split floor design). <strong>Flood</strong><br />
pro<strong>of</strong>ing would be a suitable mitigation option for these properties, which will need to<br />
include sealing any windows lower than entrance level located in the back.<br />
Page 3 <strong>of</strong> 18
Exhibit 2: Field Visit Summary – July 23, 2009<br />
Figure A4-1 Figure A4-4<br />
Area No 5: Queens Row (Along Queen St between N Union and N Lee St)<br />
These are 3 level Residential row houses with located on a private parking garage. (Refer<br />
figure A5-1) Elevated structures with the LPE as well as the first floor elevation<br />
approximately 8 feet above ground. (Refer figure A5-5)Vents appearing below the main<br />
door belong to the parking garage.<br />
No flood mitigation measures are needed for this area as the buildings are located high.<br />
The residents park their vehicles in the parking lot located behind their buildings. GIS<br />
layer seems to be incorrect; 220 N Union St is the entrance to the garage instead <strong>of</strong> a<br />
vacant land.<br />
Figure A5-1 Figure A5-5<br />
Page 4 <strong>of</strong> 18
Exhibit 2: Field Visit Summary – July 23, 2009<br />
Area No 6 (6A -6G):<br />
Commercial Structures long N Union St between Queen and King St)<br />
Most <strong>of</strong> the buildings in the area would flood from the 10.2 ft flood event. <strong>Flood</strong> pro<strong>of</strong>ing<br />
or seawall would be a suitable option. However aesthetics would be an issue with the<br />
seawall as the flood water elevation would be high. Unless it was a wall that could be<br />
moved up in a flood event would be a suitable solution. Also a temporary free-standing<br />
barrier might be a suitable solution for some <strong>of</strong> the buildings (depending on the flood<br />
elevation).<br />
6A: Commercial space above<br />
parking garage. First floor elevation<br />
at 11.6 ft. No flood protection is<br />
needed as the structure is above the<br />
garage.<br />
Figure A6a-1<br />
6B: <strong>Alexandria</strong> Seaport Foundation<br />
located along the water. May need<br />
some flood pro<strong>of</strong>ing options for the<br />
boat building and their <strong>of</strong>fice.<br />
Figure A6b-1<br />
6C: Chart house – Restaurant located on the storage space. (Refer figure A6c-2) Storage<br />
space about 3 ft above the lowest elevation. (Refer Figure A6c-4) All A/C appeared to be<br />
at the storage level. Survey was requested for this structure.<br />
Page 5 <strong>of</strong> 18
Exhibit 2: Field Visit Summary – July 23, 2009<br />
Figure A6c-2 Figure A6c-4<br />
6D: Food Pavillion – floor elevation<br />
approximately at elevation 12. No<br />
flooding problems. No mitigation<br />
measures needed for this structure.<br />
Figure A6d-1<br />
6E: First floor elevation is 8.62<br />
which starts at the door elevation.<br />
<strong>Flood</strong> pro<strong>of</strong>ing (mitigation) would<br />
be required for extreme (1% annual<br />
probability) flood events.<br />
Figure A6e-2<br />
Page 6 <strong>of</strong> 18
Exhibit 2: Field Visit Summary – July 23, 2009<br />
6F: Torpedo factory<br />
The building is used for art display, concerts, and studios. It has a historical significance<br />
as it used to be a torpedo factory.<br />
The main building has a finished first floor at 7.03ft NAVD and the extension on the<br />
south is at 6.94 ft NAVD. Extension doesn’t have any garages but the windows and door<br />
way are at the same elevation. (Refer figure A6f-2) Display portions <strong>of</strong> the windows are<br />
located below the flood elevation level. (refer to figure A6f-4)<br />
Need to consider the art display portions since they are almost close to the ground<br />
elevation. Might consider raising the display portions to the floor elevation as part <strong>of</strong> the<br />
mitigation measures as the ceiling appears to be at a high elevation and also the doors and<br />
windows need to be flood pro<strong>of</strong>ed or temporary flood barriers to the windows and doors<br />
can protect the building from flooding.<br />
Figure A6f-2 Figure A6f-4<br />
6G Old Dominion Boat Club<br />
First floor elevation is 3.75ft at ground level. (Refer figure A6g-2, may be between 4-5).<br />
Sandbags located in front <strong>of</strong> the entrance, which confirms frequent flooding <strong>of</strong> the<br />
building. Damaged during Isabel. It is not clear what is at the first floor. It appears that<br />
the bar and the party room are located upstairs. Perhaps the first floor is not in use. No<br />
basements to this structure. <strong>Flood</strong> protection, might be required. However it is a<br />
boathouse, so the structure might be designed to flood.<br />
Page 7 <strong>of</strong> 18
Exhibit 2: Field Visit Summary – July 23, 2009<br />
Figure A6g-2<br />
Area No 7 – Cameron Mews<br />
Structures with no garages. First floor <strong>of</strong> the structure is at ground level on the back<br />
side. Structures have a pedestrian court yard on the front side. Front side door located 4<br />
steps above courtyard. All the structures have a brick compound wall on the Cameron<br />
Street (back side <strong>of</strong> the structures) with gates to individual units. (refer to figure A7-3).<br />
On the tax assessors website up to 105 and 106 Cameron MW has no finished basements,<br />
however rest <strong>of</strong> the houses do have finished basements.<br />
<strong>Flood</strong> protection is necessary for these structures as they are located on the ground level<br />
and the back <strong>of</strong> the houses are located in the 8ft flood elevation. Might consider making<br />
the privacy wall as a localized flood barrier but also need to consider the drainage pipes<br />
located in the backyard. (can be observed from figure A7-5) Dry flood pro<strong>of</strong>ing might be<br />
an option here.<br />
Figure A7-3 Figure A7-5<br />
Page 8 <strong>of</strong> 18
Exhibit 2: Field Visit Summary – July 23, 2009<br />
Area No 8 – Torpedo Factory<br />
Condominiums<br />
Condos built over a parking garage.<br />
Four apartments closest to the water<br />
have had repetitive loss. The<br />
finished flood appears to be high<br />
here; however survey was requested<br />
for these apartments. (refer to figure<br />
A8-2)<br />
Figure A8-2<br />
Area No 9 – Businesses along King Street (West <strong>of</strong> Union Street)<br />
New construction was taking place at King and Union intersection. The owner is the<br />
builder <strong>of</strong> the property. (refer to figure A9-1) The first floor for all the businesses along<br />
the street appeared to be the grade or 1 to 2 steps above the grade (refer figure A9-2). No<br />
structures have basements. All structures along King Street between Union and Lee<br />
Street would require flood protection; one <strong>of</strong> these options would be removable<br />
household products, such as flood boards, air brick covers, which are fitted temporarily to<br />
individual properties to form a barrier to stop water coming in. Also should consider how<br />
the fabric <strong>of</strong> the walls, services, floors etc will respond to the pressure <strong>of</strong> the floodwater,<br />
including making walls more water resistant and repairing and sealing cracks. Ceilings<br />
appear to be high, so internal elevation in combination with other solutions could be a<br />
good mitigation option. Structures have A/C systems backside <strong>of</strong> the street, those will<br />
need to be elevated on the concrete slab. Other mitigation options might be flood wall, or<br />
temporary flood barrier.<br />
Figure A9-1 Figure A9-2<br />
Page 9 <strong>of</strong> 18
Exhibit 2: Field Visit Summary – July 23, 2009<br />
Area No 10 – (10A – 10C)<br />
(Businesses Southwest <strong>of</strong> King and Union intersection, along King Street)<br />
10A: These are all commercial structures located along union and King Street. The ones<br />
on the union street appear to have 2 – 3 steps up to the door way and are about 2 ft high<br />
from the ground. (figure A10a-8). Spoke to one <strong>of</strong> the representatives from 107 S Union<br />
Street business. This structure received 4 ft <strong>of</strong> water during Isabel. Same mitigation<br />
options should be considered as for Area 9.<br />
Figure A10a-8 <br />
Structures along King Street are about a foot higher than the ground. They don’t have<br />
basements and the door ways are at grade level (figure A10a-3).<br />
Figure A10a-3<br />
Page 10 <strong>of</strong> 18
Exhibit 2: Field Visit Summary – July 23, 2009<br />
10B: business store along S Union Street<br />
Structure located on the garage, the front <strong>of</strong> the building has few shops, with stairs<br />
leading up to the shops. The water is not likely to reach the floor above the garage,<br />
therefore no mitigation needed for this structure.<br />
10C: (Intersection <strong>of</strong> Prince and S Union Street – structures along Union Street)<br />
Door ways/first floors located at the grade level or 1 step above for businesses. Christmas<br />
Attic’s first floor appeared to be a foot above the grade. These shops appears to have high<br />
ceilings, might be suitable for the same mitigation options as Area 9.<br />
Residential structures along Prince Street also have 1-2 steps above the grade. First floor<br />
appeared to be around 2ft above the road. (Can be observed in Figure A10c-3)<br />
Figure<br />
A10c-3 <br />
Area No 11- Southwest <strong>of</strong> Union and Prince Intersection<br />
All these residential structures along Prince Street don’t have any basements and also just<br />
about 10 inches above the road. 110 Prince St is outside the 10.2ft flood boundary, but<br />
flooded 22 inches from the toilet. Dry flood pro<strong>of</strong>ing may be an option here if there are<br />
no basements.<br />
The GIS database shows a misleading floor elevation for this structure. First floor for this<br />
structure appeared around 7.0 (refer figure A11-1 below)<br />
Page 11 <strong>of</strong> 18
Fig A11-1<br />
Exhibit 2: Field Visit Summary – July 23, 2009<br />
There are other commercial structures / shops located along S Union Street. Many <strong>of</strong><br />
them will require flood protection, as the FFE is between 6-7 ft. There are no current<br />
flood protection measures for all these structures. The Carriage House Shop is about a<br />
foot above the grade (3 steps). (Refer figure A11-3) survey was requested. Dry flood<br />
pro<strong>of</strong>ing or internal elevation may be an option.<br />
Figure A11-3<br />
Page 12 <strong>of</strong> 18
Exhibit 2: Field Visit Summary – July 23, 2009<br />
Structure to the south <strong>of</strong> The Carriage House c<strong>of</strong>fee shop is an elevated structure built<br />
above a garage, no mitigation would be required.<br />
Area 12 – Structures along S Union Street between Duke St and Wolfe Street<br />
Structures don’t have any basements. Most <strong>of</strong> the Residential structures along Duke<br />
Street have their door ways a step above the grade (figure A12-3). First floor elevations<br />
look fine in the database. Some <strong>of</strong> the structures along the Union street have their garages<br />
below the first floor elevation. (Refer figure 12-1) The adjacent grade is located at 12.<br />
According to the information from the resident <strong>of</strong> 303 S Union Street, the structure was<br />
never flooded and the first floor appeared to be approximately at 15. (Refer figure A12-<br />
5). No flood mitigation is required.<br />
Figure A12-3 Figure A12-5<br />
Area 13 – Residential structures just South side <strong>of</strong> Wolfe Street<br />
Structures have no basements and<br />
garages and the first floor appeared to<br />
be about 1.5 feet above the grade. GIS<br />
elevation data looks correct. (Refer<br />
figure A13-3) No flood mitigation is<br />
required.<br />
Figure A13<br />
Page 13 <strong>of</strong> 18
Exhibit 2: Field Visit Summary – July 23, 2009<br />
Area No 14 – Harborside Development<br />
All the structures in this development are located on the parking garage. (Refer figure<br />
A14-1) and the first floor appeared to be a minimum <strong>of</strong> 3 feet above the grade<br />
everywhere. Some also have a privacy wall on the water side and are located high.<br />
(Figure A14-6). No flood mitigations are required for this development.<br />
Figure A14-1 Figure A14-6<br />
Area No 15 – Robinson South Terminal<br />
The loading dock is 3 feet above the<br />
grade and first floor is at 14 for this<br />
building (Figure A15-2). No flood<br />
mitigation measures are required<br />
for this structure. Loading dock<br />
appears to be at grade?<br />
Figure A15-2<br />
Page 14 <strong>of</strong> 18
Exhibit 2: Field Visit Summary – July 23, 2009<br />
Area No 16 – Commercial stores East <strong>of</strong> South Union Street between Duke and<br />
Prince Street<br />
Area consists <strong>of</strong> the Art league, Chadwick’s place restaurant, <strong>Potomac</strong> River Boat<br />
Company etc. Mystic Jewelers is an elevated structure and its fist floor is at 10.6. The<br />
first floors are at the grade for these structure or 1 or 2 steps above the grade. The first<br />
floor values for big wheel bikes, gem shop and the empty <strong>of</strong>fice at the corner is bellow<br />
8ft. (Figure A16-3)<br />
The first floor elevations for the <strong>Potomac</strong> River boat company appear to be around 6 and<br />
for Art league about 10, we requested surveys for these structures. (Figure A16-1) There<br />
is a low point <strong>of</strong> entry to the Art League in the east side <strong>of</strong> the building. Dry flood<br />
pro<strong>of</strong>ing or internal elevation would be an option here. It’s possible that the first floor is<br />
already elevated. Survey will tell.<br />
Figure A16-1 Figure A16-3<br />
Area No 17 – (ex) Olson’s book store FFE is at 5.87. The property flooded several times<br />
in the past and at the site visit in July 2009 the building was vacant. It might be a suitable<br />
property for the city to acquire, however there might be structural limitation to it.<br />
Alternatively a combination <strong>of</strong> mitigations could be provided. These could be, raising the<br />
ground internally, sealing the walls, window, blocking the doors with removable boards.<br />
Area No 18 - structure at the corner <strong>of</strong> Wales and Strand Street is about 3 ft.<br />
All the first floors appeared to be at the grade or a step above that. (Figure A18-1) survey<br />
is being requested for these units. For Starbucks and Mai Thai, flood mitigation will be<br />
required, both had repetitive loss claims and the FFE is between 6-7ft. The Mai Thai is<br />
already elevated internally. The first floor is concrete for both places. For this block <strong>of</strong><br />
buildings buying out would be a suitable option as the street and the buildings floods<br />
regularly as well as dry flood pro<strong>of</strong>ing would be an option here.<br />
Page 15 <strong>of</strong> 18
Figure A18-1 <br />
Exhibit 2: Field Visit Summary – July 23, 2009<br />
Area No 19 and 20 – Backyard Boats<br />
First floor elevation and the lowest point <strong>of</strong> entry are 2 to 3 steps above the grade. (Figure<br />
A19-5). Structures on the <strong>Alexandria</strong> Street have their lowest point <strong>of</strong> entry as well as<br />
first floors at the grade. (Figure A19-9)<br />
Figure A19-5 figure A19-9<br />
Structures west <strong>of</strong> South Union Street are on the garages and there appeared to be a flood<br />
gate at the entrance <strong>of</strong> the garage. (Refer figure A20-3). Also one <strong>of</strong> the structures in this<br />
building has its first floor lower than the ground. Stairs appeared at the entrance. (Figure<br />
A20-1) Peter Chaput mentioned that a private contractor was hired to flood pro<strong>of</strong> these<br />
buildings, so no mitigation is needed.<br />
Page 16 <strong>of</strong> 18
Exhibit 2: Field Visit Summary – July 23, 2009<br />
Figure A20-1 figure A20-3<br />
Area 21<br />
This is the most southern part <strong>of</strong> the study area, located just to the north <strong>of</strong> I495. There is<br />
a forest between I-495 and properties. Most <strong>of</strong> the buildings have finished basements and<br />
somewhat elevated. However some <strong>of</strong> them have low point <strong>of</strong> entry to the lowest floor.<br />
See Figure 21-1, 21-2. Also found some sandbags in front <strong>of</strong> 211 Lee Ct, see figure 21-3<br />
bellow.<br />
Figure 21-1 Figure 21-2<br />
Page 17 <strong>of</strong> 18
Figure 21-3<br />
Exhibit 2: Field Visit Summary – July 23, 2009<br />
210 Lee Ct seems to be abandoned, only built in 1961. It is located in the 8 ft <strong>Flood</strong> Plain<br />
and the first floor seems to be 1 step above ground. The FFE is 8.74. See picture 21-3.<br />
There is a wall next to the building, but not behind where the water would be coming<br />
from, see picture 21-4. Also a swimming pool located next to the building.<br />
Figure 21-3 Figure 21-4<br />
Perhaps buy out would be a feasible solution for 210 Lee Ct. It would not only provide<br />
final solution to the flooding problem, but also it would provide environmental benefits,<br />
as it is located next to the forest(park), which could be extended. However also elevation,<br />
flood pro<strong>of</strong>ing would probably be suitable. Alternatively Area 21 a small flood wall<br />
could provide protection as well.<br />
Page 18 <strong>of</strong> 18
Exhibit 3: Rainfall Data<br />
TR-20 was used and the online version <strong>of</strong> the National Oceanic and Atmospheric<br />
Administration’s (NOAA) Atlas 14 were averaged to get the rainfall precipitation frequency<br />
estimates used for our study as shown in Table 1.<br />
Average rainfall data was determined from the Windows version <strong>of</strong> TR-20. Screen shots from<br />
TR-20 and Atlas 14 are shown in Figures 1 and 2 below.<br />
Table 1: Rainfall precipitation frequency data used for study<br />
Precipitation (inches)<br />
Frequency Win TR-55 NOAA Average<br />
10-year 5.5 4.76 5.13<br />
25-year 6.0 5.96 5.98<br />
50-year 7.0 7.01 7.01<br />
100-year 7.7 8.21 7.96<br />
Figure 1: Screen shot from Win TR-20
Figure 2: Screen shot from NOAA Atlas 14
Appendix E<br />
Economic Valuation Results
<strong>Potomac</strong> River <strong>Waterfront</strong> <strong>Flood</strong> <strong>Mitigation</strong> <strong>Study</strong><br />
BENEFITS<br />
<strong>Flood</strong> Wall 1<br />
<strong>Flood</strong> Pro<strong>of</strong>ing 2<br />
Acquisition 3<br />
Walkway 4<br />
Berm 5<br />
Benefit Cost Summary for All Structural Projects<br />
King Street $ 1,017,062 $ 7,470,452 $ 4,227,045<br />
N/A<br />
<strong>Waterfront</strong> Commercial $ 11,022,291 $ 6,727,889 $ 7,336,054 $ 14,745,415<br />
N/A<br />
N Union St $ 156,934 $ 733,539 $ 608,916<br />
N/A<br />
Jones Point N/A $ 230,843 $ 197,424<br />
N/A $ 236,410<br />
Total: $ 12,196,287 $ 14,931,880 $ 12,172,015 $ 14,745,415 $ 236,410<br />
COST <strong>Flood</strong> Wall <strong>Flood</strong> Pro<strong>of</strong>ing Acquisition Walkway Berm<br />
King Street $ 1,180,560 $ 90,826,273<br />
N/A<br />
<strong>Waterfront</strong> Commercial $ 18,863,273 $ 2,790,754 $ 104,375,470 $<br />
6,072,490<br />
N/A<br />
N Union St $ 1,084,100 $ 19,865,796 N/A<br />
Jones Point N/A $ 238,050 $ 11,279,417 N/A $ 5,491,975<br />
Total: $ 18,863,273 $ 5,055,414 $ 215,067,539 $ 6,072,490 $ 5,491,975<br />
BCR <strong>Flood</strong> Wall <strong>Flood</strong> Pro<strong>of</strong>ing Acquisition Walkway Berm<br />
King Street 6.33 0.05 N/A<br />
2.43<br />
<strong>Waterfront</strong> Commercial 0.65<br />
2.41 0.07 N/A<br />
N Union St 0.68 0.03 no protection N/A<br />
Jones Point N/A 0.97 0.02 no protection 0.04<br />
1 Structure lifetime is 50 years, and provides protection to the 100 year flood event<br />
2 <strong>Flood</strong>pro<strong>of</strong>ing lifetime is 30 years<br />
3 Acquisition lifetime is 100 years<br />
4 Walkway lifetime is 50 years<br />
5 Berm lifetime is 50 years
Appendix F<br />
<strong>Flood</strong>wall
38<br />
40<br />
38<br />
4 6<br />
40<br />
34<br />
28<br />
14<br />
30<br />
30<br />
40<br />
44<br />
N SAINT ASAPH ST<br />
14<br />
34<br />
CLIENT<br />
PROJ<br />
14<br />
42<br />
32<br />
22<br />
34<br />
32<br />
36<br />
34<br />
24<br />
14<br />
36<br />
38<br />
36<br />
30<br />
JEFFERSON CT<br />
REVISION NO<br />
SCALE<br />
32<br />
30<br />
16<br />
34<br />
S PITT ST<br />
32<br />
14<br />
32<br />
18<br />
16<br />
30<br />
16<br />
24<br />
24<br />
22<br />
18<br />
22<br />
30<br />
16<br />
22<br />
24<br />
26<br />
N PITT ST<br />
PRINCE ST<br />
S ROYAL ST<br />
<strong>City</strong> <strong>of</strong> <strong>Alexandria</strong><br />
22<br />
20<br />
20<br />
20<br />
26<br />
32<br />
22<br />
24<br />
S FAIRFAX ST<br />
22<br />
30<br />
28<br />
32<br />
32<br />
28<br />
16<br />
32<br />
32<br />
28<br />
30<br />
34<br />
34<br />
30<br />
30<br />
N ROYAL ST<br />
24<br />
30<br />
3 4<br />
3 2<br />
3 2<br />
14<br />
34<br />
22<br />
30<br />
14<br />
34<br />
34<br />
28<br />
2 8<br />
34<br />
34<br />
CAMERON ST<br />
WILKES ST<br />
34<br />
34<br />
26<br />
26<br />
34<br />
34<br />
14<br />
30<br />
30<br />
32<br />
28<br />
30<br />
30<br />
30<br />
32<br />
34<br />
34<br />
32<br />
30<br />
34<br />
34<br />
34<br />
30<br />
32<br />
14<br />
28<br />
12<br />
8<br />
3<br />
GIBBON ST<br />
<strong>Potomac</strong> River <strong>Waterfront</strong> <strong>Flood</strong> <strong>Mitigation</strong> <strong>Study</strong><br />
1 inch = 300 feet<br />
W:\<strong>City</strong> <strong>of</strong> <strong>Alexandria</strong>\15298470 - Lower King<br />
St\GIS\Projects\<strong>Flood</strong>wall_Option1_11X17.mxd<br />
0 DES BY<br />
DR BY<br />
CHK BY<br />
CJL<br />
CJL<br />
xxx<br />
TANCIL CT<br />
N FAIRFAX ST<br />
26<br />
2<br />
28<br />
32<br />
34<br />
14<br />
26<br />
28<br />
RAMSAY AL<br />
SWIFTS AL<br />
09/11/09<br />
09/24/09<br />
00/00/00<br />
S LEE ST<br />
32<br />
34<br />
34<br />
32<br />
36<br />
24<br />
22<br />
26<br />
20<br />
18<br />
26<br />
24<br />
30<br />
12<br />
22<br />
QUEEN ST<br />
THOMPSONS AL<br />
WOLFE ST<br />
8<br />
34<br />
12<br />
14<br />
20<br />
18<br />
24<br />
KING ST<br />
14<br />
DUKE ST<br />
6<br />
S UNION ST<br />
TOBACCO QY<br />
14<br />
16<br />
12<br />
16<br />
16<br />
8<br />
10<br />
16<br />
1 4<br />
20<br />
10<br />
16<br />
20<br />
12<br />
24<br />
28<br />
1 4<br />
N LEE ST<br />
16<br />
16<br />
16<br />
8<br />
14<br />
12<br />
20<br />
18<br />
16<br />
32<br />
20<br />
20<br />
14<br />
18<br />
18<br />
8<br />
10<br />
20<br />
¹<br />
0 75 150 300<br />
16<br />
12<br />
10<br />
18<br />
18<br />
18<br />
18<br />
8<br />
20<br />
6<br />
8<br />
14<br />
12<br />
22<br />
12<br />
18<br />
1 6<br />
14<br />
30<br />
26<br />
12<br />
8<br />
16<br />
18<br />
N UNION ST<br />
8<br />
2<br />
8<br />
14<br />
ORONOCO ST<br />
6<br />
6<br />
10<br />
16<br />
PRINCESS ST<br />
QUAY ST<br />
S UNION ST<br />
Feet<br />
TITLE<br />
16<br />
STRAND ST<br />
12<br />
10<br />
4<br />
10<br />
6<br />
10<br />
10<br />
10<br />
6<br />
10<br />
8<br />
8<br />
6<br />
8<br />
8<br />
14<br />
CAMERON ST<br />
STRAND ST<br />
4 2<br />
2<br />
6<br />
2<br />
14<br />
14<br />
12<br />
10<br />
8<br />
14<br />
10<br />
12<br />
4<br />
4<br />
<strong>Flood</strong>wall Layout Option 1<br />
200 Orchard Ridge Drive<br />
Gaithersburg, MD 20878<br />
Legend<br />
<strong>Flood</strong>wall Option 1<br />
<strong>Flood</strong>wall Option 1 Drainage Area<br />
Area 1<br />
Area 2<br />
2ft Contours<br />
PROJ NO<br />
EXHIBIT<br />
1-1<br />
15298592
22<br />
N PITT ST<br />
22<br />
22<br />
30<br />
20<br />
CLIENT<br />
PROJ<br />
20<br />
22<br />
24<br />
26<br />
22<br />
24<br />
REVISION NO<br />
SCALE<br />
20<br />
20<br />
30<br />
26<br />
32<br />
16<br />
30<br />
S ROYAL ST N ROYAL ST<br />
PRINCE ST<br />
28<br />
30<br />
32<br />
32<br />
34<br />
30<br />
14<br />
34<br />
30<br />
<strong>City</strong> <strong>of</strong> <strong>Alexandria</strong><br />
32<br />
24<br />
16<br />
30<br />
30<br />
34<br />
34<br />
32<br />
S FAIRFAX ST<br />
34<br />
30<br />
28<br />
22<br />
14<br />
24<br />
28<br />
26<br />
30<br />
26<br />
34<br />
34<br />
28<br />
28<br />
34<br />
26<br />
34<br />
N FAIRFAX ST<br />
30<br />
32<br />
34<br />
32<br />
30<br />
30<br />
18<br />
30<br />
26<br />
CAMERON ST<br />
34<br />
32<br />
32<br />
32<br />
28<br />
SWIFTS AL<br />
<strong>Potomac</strong> River <strong>Waterfront</strong> <strong>Flood</strong> <strong>Mitigation</strong> <strong>Study</strong><br />
1 inch = 200 feet<br />
W:\<strong>City</strong> <strong>of</strong> <strong>Alexandria</strong>\15298470 - Lower King St\Report\<br />
Draft Report\New Figures\<strong>Flood</strong>wall_Option2_11X17.mxd<br />
0 DES BY<br />
DR BY<br />
CHK BY<br />
CJL<br />
CJL<br />
xxx<br />
34<br />
30<br />
34<br />
18<br />
26<br />
RAMSAY AL<br />
34<br />
32<br />
09/11/09<br />
09/24/09<br />
00/00/00<br />
28<br />
12<br />
30<br />
34<br />
34<br />
22<br />
20<br />
32<br />
22<br />
24<br />
26<br />
26<br />
3 6<br />
THOMPSONS AL<br />
S LEE ST<br />
36<br />
18<br />
18<br />
12<br />
14<br />
34<br />
20<br />
KING ST<br />
DUKE ST<br />
WOLFE ST<br />
POTOMAC CT<br />
24<br />
20<br />
14<br />
14<br />
22<br />
18<br />
10<br />
20<br />
16<br />
N LEE ST<br />
14<br />
16<br />
12<br />
14<br />
¹<br />
0 50 100 200<br />
16<br />
12<br />
20<br />
16<br />
20<br />
20<br />
16<br />
14<br />
12<br />
20<br />
18<br />
18<br />
16<br />
32<br />
FAYETTE AL<br />
WALES AL<br />
12<br />
Feet<br />
16<br />
14<br />
20<br />
10<br />
18<br />
18<br />
8<br />
12<br />
16<br />
16<br />
8<br />
18<br />
PRINCESS ST<br />
TITLE<br />
16<br />
8<br />
32<br />
6<br />
8<br />
10<br />
14<br />
24<br />
26<br />
16<br />
QUAY ST<br />
QUEEN ST<br />
14<br />
28<br />
30<br />
12<br />
14<br />
N UNION ST<br />
10<br />
12<br />
8<br />
14<br />
CAMERON ME<br />
S UNION ST<br />
2<br />
6<br />
6<br />
WALES AL<br />
10<br />
10<br />
4<br />
10<br />
6<br />
8 10<br />
16<br />
STRAND ST<br />
STRAND ST<br />
10<br />
12<br />
6<br />
10<br />
8<br />
8<br />
4<br />
THOMPSONS AL<br />
6<br />
8<br />
14<br />
CAMERON ST<br />
<strong>Flood</strong>wall Layout Option 2<br />
2<br />
200 Orchard Ridge Drive<br />
Gaithersburg, MD 20878<br />
6<br />
2<br />
2<br />
14<br />
14<br />
12<br />
10<br />
10<br />
12<br />
14<br />
8<br />
4<br />
14<br />
Legend<br />
<strong>Flood</strong>wall Option 2<br />
<strong>Flood</strong>wall Option 2 Drainage Area<br />
Area 1<br />
Area 2<br />
2ft Contours<br />
PROJ NO<br />
EXHIBIT<br />
1-2<br />
15298592
46<br />
44<br />
38<br />
44<br />
42<br />
40<br />
42<br />
44<br />
44<br />
36<br />
22<br />
36<br />
18<br />
44<br />
36<br />
38<br />
40<br />
34<br />
46<br />
34<br />
16<br />
20<br />
CLIENT<br />
PROJ<br />
42<br />
46<br />
38<br />
34<br />
44<br />
S SAINT ASAPH ST<br />
4 4<br />
44<br />
36<br />
26<br />
14<br />
REVISION NO<br />
SCALE<br />
34<br />
42<br />
38<br />
34<br />
28<br />
14<br />
30<br />
30<br />
40<br />
N SAINT ASAPH ST<br />
14<br />
22<br />
32<br />
24<br />
14<br />
36<br />
30<br />
JEFFERSON CT<br />
38<br />
36<br />
32<br />
30<br />
16<br />
34<br />
S PITT ST<br />
32<br />
32<br />
18<br />
16<br />
14<br />
<strong>City</strong> <strong>of</strong> <strong>Alexandria</strong><br />
30<br />
22<br />
24<br />
24<br />
PRINCE ST<br />
30<br />
S ROYAL ST<br />
24<br />
22<br />
30<br />
20<br />
18<br />
22<br />
24<br />
26<br />
N PITT ST<br />
22<br />
16<br />
20<br />
20<br />
32<br />
22<br />
S FAIRFAX ST<br />
32<br />
22<br />
32<br />
30<br />
10<br />
28<br />
28<br />
16<br />
32<br />
32<br />
28<br />
34<br />
30<br />
30<br />
34<br />
30<br />
N ROYAL ST<br />
24<br />
34<br />
3 2<br />
3 2<br />
14<br />
30<br />
14<br />
34<br />
34<br />
28<br />
34<br />
34<br />
CAMERON ST<br />
30<br />
22<br />
34<br />
2 8<br />
26<br />
26<br />
34<br />
WILKES ST<br />
<strong>Potomac</strong> River <strong>Waterfront</strong> <strong>Flood</strong> <strong>Mitigation</strong> <strong>Study</strong><br />
1 inch = 300 feet<br />
W:\<strong>City</strong> <strong>of</strong> <strong>Alexandria</strong>\15298470 - Lower King<br />
St\GIS\Projects\<strong>Flood</strong>wall_Option3_11X17.mxd<br />
0 DES BY<br />
DR BY<br />
CHK BY<br />
CJL<br />
CJL<br />
xxx<br />
34<br />
09/11/09<br />
09/24/09<br />
00/00/00<br />
34<br />
14<br />
30<br />
30<br />
32<br />
28<br />
30<br />
32<br />
34<br />
34<br />
34<br />
32<br />
30<br />
30<br />
34<br />
34<br />
30<br />
32<br />
14<br />
28<br />
12<br />
DUKE ST<br />
8<br />
3<br />
GIBBON ST<br />
TANCIL CT<br />
N FAIRFAX ST<br />
26<br />
2<br />
28<br />
32<br />
34<br />
14<br />
S LEE ST<br />
34<br />
36<br />
26<br />
28<br />
32<br />
34<br />
30<br />
24<br />
22<br />
26<br />
26<br />
24<br />
34<br />
QUEEN ST<br />
THOMPSONS AL<br />
RAMSAY AL<br />
SWIFTS AL<br />
WOLFE ST<br />
8<br />
20<br />
18<br />
34<br />
12<br />
12<br />
14<br />
24 20<br />
KING ST<br />
6<br />
S UNION ST<br />
TOBACCO QY<br />
18<br />
14<br />
¹<br />
0 75 150 300<br />
16<br />
22<br />
12<br />
16<br />
20<br />
8<br />
20 18 14<br />
14<br />
14<br />
12<br />
8<br />
16<br />
16<br />
10<br />
22 10<br />
Feet<br />
16<br />
12<br />
16<br />
16<br />
20<br />
26<br />
28<br />
12<br />
TITLE<br />
N LEE ST<br />
18<br />
16<br />
32<br />
20<br />
20<br />
8<br />
10<br />
14<br />
18<br />
20<br />
16<br />
12<br />
10<br />
18<br />
18<br />
30<br />
18<br />
8<br />
6<br />
8<br />
18<br />
14<br />
14<br />
14<br />
20<br />
18<br />
12<br />
16<br />
18<br />
16<br />
24<br />
10<br />
8<br />
16<br />
18<br />
N UNION ST<br />
8<br />
2<br />
8<br />
6<br />
14<br />
ORONOCO ST<br />
16<br />
6<br />
10<br />
16<br />
PRINCESS ST<br />
QUAY ST<br />
S UNION ST<br />
STRAND ST<br />
12<br />
10<br />
4<br />
10<br />
6<br />
10<br />
10<br />
10<br />
10<br />
8<br />
8<br />
6<br />
6<br />
8<br />
8<br />
14<br />
CAMERON ST<br />
STRAND ST<br />
4 2<br />
2<br />
6<br />
<strong>Flood</strong>wall Layout Option 3<br />
2<br />
14<br />
14<br />
10<br />
12<br />
8<br />
14<br />
10<br />
4<br />
14<br />
200 Orchard Ridge Drive<br />
Gaithersburg, MD 20878<br />
4<br />
Legend<br />
<strong>Flood</strong>wall Option 3<br />
<strong>Flood</strong>wall Option 3 Drainage Area<br />
Area 1<br />
Area 2<br />
2ft Contours<br />
PROJ NO<br />
EXHIBIT<br />
1-3<br />
15298592
34<br />
38<br />
30<br />
30<br />
32<br />
34<br />
34<br />
32<br />
S PITT ST<br />
30<br />
32<br />
CLIENT<br />
PROJ<br />
30<br />
N PITT ST<br />
REVISION NO<br />
SCALE<br />
32<br />
26<br />
28<br />
24<br />
28<br />
22<br />
24<br />
32<br />
Legend<br />
30<br />
22<br />
30<br />
22<br />
PITT ME<br />
30<br />
22<br />
24<br />
26<br />
20<br />
KING ST<br />
20<br />
28<br />
PRINCE ST<br />
<strong>Flood</strong>wall Option 4<br />
26<br />
24<br />
S ROYAL ST<br />
ORONOCO ST<br />
22<br />
32<br />
N ROYAL ST<br />
30<br />
16<br />
30<br />
32<br />
32<br />
<strong>Flood</strong>wall Option 4 Drainage Area<br />
Area 1<br />
Area 2<br />
2ft Contours<br />
<strong>City</strong> <strong>of</strong> <strong>Alexandria</strong><br />
34<br />
30<br />
30<br />
28<br />
34<br />
32<br />
30<br />
34<br />
34<br />
32<br />
34<br />
22<br />
S FAIRFAX ST<br />
24 28<br />
<strong>Potomac</strong> River <strong>Waterfront</strong> <strong>Flood</strong> <strong>Mitigation</strong> <strong>Study</strong><br />
1 inch = 200 feet<br />
W:\<strong>City</strong> <strong>of</strong> <strong>Alexandria</strong>\15298470 - Lower King St\Report\<br />
Draft Report\New Figures\<strong>Flood</strong>wall_Option4_11X17.mxd<br />
0 DES BY<br />
DR BY<br />
CHK BY<br />
CJL<br />
CJL<br />
xxx<br />
14<br />
26<br />
30<br />
14<br />
16<br />
28<br />
34<br />
28<br />
34<br />
34<br />
26<br />
09/11/09<br />
09/24/09<br />
00/00/00<br />
30<br />
32<br />
32<br />
30<br />
34<br />
30<br />
26<br />
CAMERON ST<br />
N FAIRFAX ST<br />
32<br />
34<br />
26<br />
32<br />
34<br />
28<br />
30<br />
12<br />
TANCIL CT<br />
SWIFTS AL<br />
32<br />
14<br />
34<br />
26<br />
30<br />
28<br />
32<br />
30<br />
20<br />
24<br />
22<br />
14<br />
24<br />
26<br />
34<br />
3 6<br />
THOMPSONS AL<br />
RAMSAY AL<br />
S LEE ST<br />
¹<br />
0 50 100 200<br />
12<br />
22<br />
12<br />
14<br />
34<br />
DUKE ST<br />
Feet<br />
TITLE<br />
TOBACCO QY<br />
14<br />
20<br />
24<br />
20<br />
22<br />
18<br />
20<br />
16<br />
14<br />
14<br />
16<br />
12<br />
20<br />
16<br />
18<br />
16<br />
20<br />
20<br />
16<br />
N LEE ST<br />
FAYETTE AL<br />
16<br />
20<br />
18<br />
18<br />
16<br />
32<br />
WALES AL<br />
16<br />
20<br />
10<br />
6<br />
8<br />
18<br />
18<br />
18<br />
PRINCESS ST<br />
16<br />
28<br />
8<br />
32<br />
6<br />
8<br />
8<br />
18<br />
QUEEN ST<br />
S UNION ST<br />
14<br />
16<br />
12<br />
30<br />
14<br />
18<br />
18<br />
24<br />
26<br />
16<br />
QUAY ST<br />
CAMERON ME<br />
16<br />
10<br />
12<br />
<strong>Flood</strong>wall Layout Option 4<br />
18<br />
2<br />
6<br />
6<br />
WALES AL<br />
14<br />
16<br />
16<br />
STRAND ST<br />
200 Orchard Ridge Drive<br />
Gaithersburg, MD 20878<br />
4<br />
STRAND ST<br />
8<br />
8<br />
6<br />
N UNION ST<br />
8<br />
4<br />
THOMPSONS AL<br />
6<br />
14<br />
CAMERON ST<br />
2<br />
2<br />
14<br />
14<br />
10<br />
12<br />
14<br />
12<br />
10<br />
14<br />
8<br />
4<br />
14<br />
2<br />
PROJ NO<br />
EXHIBIT<br />
4<br />
1-4<br />
15298592
48<br />
44<br />
38<br />
36<br />
38<br />
18<br />
46<br />
42<br />
38<br />
42<br />
26<br />
22<br />
CLIENT<br />
PROJ<br />
N WASHINGTON ST<br />
24<br />
42<br />
46<br />
4 6<br />
REVISION NO<br />
SCALE<br />
G:\w\x\.mxd<br />
40<br />
40<br />
44<br />
40<br />
48<br />
46<br />
44<br />
44<br />
44<br />
42<br />
44<br />
3 8<br />
42<br />
44<br />
34<br />
46<br />
16<br />
20<br />
46<br />
46<br />
34<br />
44<br />
BROCKETTS AL<br />
38<br />
40<br />
36<br />
WILKES ST<br />
34<br />
44<br />
4 4<br />
36<br />
34<br />
42<br />
38<br />
34<br />
28<br />
30<br />
30<br />
46<br />
14<br />
32<br />
24<br />
14<br />
36<br />
38<br />
30<br />
30<br />
16<br />
34<br />
30<br />
32<br />
32<br />
18<br />
16<br />
24<br />
24<br />
22<br />
24<br />
20<br />
30<br />
18<br />
14 26<br />
14<br />
22<br />
32<br />
S PITT ST<br />
S SAINT ASAPH ST N SAINT ASAPH ST<br />
GIBBON ST<br />
<strong>City</strong> <strong>of</strong> <strong>Alexandria</strong><br />
28<br />
PRINCE ST<br />
JEFFERSON CT<br />
22<br />
20<br />
22<br />
24<br />
22<br />
N PITT ST<br />
20<br />
20<br />
22<br />
26<br />
14<br />
32<br />
16<br />
28<br />
22<br />
30<br />
16<br />
32<br />
28<br />
32<br />
32<br />
28<br />
34<br />
30<br />
30<br />
34<br />
30<br />
24<br />
30<br />
3 2<br />
32<br />
3 4<br />
S ROYAL ST N ROYAL ST<br />
S FAIRFAX ST<br />
<strong>Potomac</strong> River <strong>Waterfront</strong> <strong>Flood</strong> <strong>Mitigation</strong> <strong>Study</strong><br />
1 inch = 300 feet<br />
0 DES BY<br />
DR BY<br />
CHK BY<br />
CJL<br />
CJL<br />
xxx<br />
09/11/09<br />
09/24/09<br />
00/00/00<br />
14<br />
24<br />
30<br />
14<br />
34<br />
34<br />
34<br />
2 8<br />
26<br />
26<br />
34<br />
14<br />
32<br />
28<br />
34<br />
30<br />
34<br />
32<br />
34<br />
32<br />
16<br />
PENDLETON ST<br />
CAMERON ST<br />
34<br />
28<br />
34<br />
34<br />
34<br />
30<br />
30<br />
34<br />
30<br />
30<br />
32<br />
34<br />
34<br />
30<br />
14<br />
12<br />
DUKE ST<br />
TANCIL CT<br />
8<br />
3<br />
N FAIRFAX ST<br />
26<br />
2<br />
28<br />
32<br />
34<br />
14<br />
2830<br />
34<br />
36<br />
26<br />
RAMSAY AL<br />
SWIFTS AL<br />
S LEE ST<br />
24<br />
22<br />
30<br />
32<br />
34<br />
WOLFE ST<br />
¹<br />
0 75 150 300<br />
3 4<br />
26<br />
14<br />
26<br />
32<br />
24<br />
34<br />
20<br />
18<br />
6<br />
10<br />
18<br />
22<br />
QUEEN ST<br />
THOMPSONS AL<br />
Feet<br />
8<br />
12<br />
12<br />
14<br />
8<br />
20<br />
18<br />
14<br />
24<br />
KING ST<br />
S UNION ST<br />
TITLE<br />
TOBACCO QY<br />
16<br />
22<br />
10<br />
16<br />
14 18 20<br />
8<br />
16<br />
10<br />
16<br />
1 4<br />
16<br />
16<br />
20<br />
16<br />
26<br />
28<br />
2 4<br />
12<br />
N LEE ST<br />
12<br />
20<br />
18<br />
16<br />
32<br />
18<br />
20<br />
20<br />
20<br />
8<br />
10<br />
12<br />
20<br />
16<br />
18<br />
18<br />
18<br />
8<br />
14<br />
6<br />
8<br />
16<br />
18<br />
12<br />
14<br />
18<br />
14<br />
12<br />
16<br />
30<br />
18<br />
12<br />
14 18<br />
1 6<br />
12<br />
8<br />
8<br />
8<br />
16 14<br />
18<br />
ORONOCO ST<br />
N UNION ST<br />
2<br />
6<br />
10<br />
16<br />
PRINCESS ST<br />
QUAY ST<br />
S UNION ST<br />
WILKES ST<br />
16<br />
6<br />
STRAND ST<br />
12<br />
10<br />
4<br />
10<br />
6<br />
10<br />
10<br />
1 0<br />
8<br />
8<br />
6<br />
8<br />
8<br />
6<br />
14<br />
CAMERON ST<br />
STRAND ST<br />
<strong>Flood</strong>wall Layout Option 5<br />
4<br />
2<br />
2<br />
6<br />
200 Orchard Ridge Drive<br />
Gaithersburg, MD 20878<br />
2<br />
14<br />
14<br />
12<br />
10<br />
8<br />
10<br />
12<br />
4<br />
14<br />
4<br />
Legend<br />
<strong>Flood</strong>wall Option 5<br />
<strong>Flood</strong>wall Option 5 Drainage Area<br />
Area 1<br />
Area 2<br />
2ft Contours<br />
PROJ NO<br />
EXHIBIT<br />
1-5<br />
15298592
CLIENT<br />
PROJ<br />
REVISION NO<br />
SCALE<br />
<strong>City</strong> <strong>of</strong> <strong>Alexandria</strong><br />
<strong>Potomac</strong> River <strong>Waterfront</strong> <strong>Flood</strong> <strong>Mitigation</strong> <strong>Study</strong><br />
W:\<strong>City</strong> <strong>of</strong> <strong>Alexandria</strong>\15298470 - Lower King St\Report\Draft<br />
Report\New Figures\<strong>Flood</strong>wall Figures\<strong>Flood</strong>wall_Spec.mxd<br />
0 DES BY<br />
DR BY<br />
CHK BY<br />
CJL<br />
CJL<br />
MER<br />
09/30/09<br />
09/30/09<br />
09/10/09<br />
TITLE<br />
<strong>Flood</strong>wall - Cross Section<br />
200 Orchard Ridge Drive<br />
Gaithersburg, MD 20878<br />
PROJ NO<br />
EXHIBIT<br />
2-1<br />
15298592
CLIENT<br />
PROJ<br />
REVISION NO<br />
SCALE<br />
<strong>City</strong> <strong>of</strong> <strong>Alexandria</strong><br />
<strong>Potomac</strong> River <strong>Waterfront</strong> <strong>Flood</strong> <strong>Mitigation</strong> <strong>Study</strong><br />
W:\<strong>City</strong> <strong>of</strong> <strong>Alexandria</strong>\15298470 - Lower King St\Report\Draft<br />
Report\New Figures\<strong>Flood</strong>wall Figures\<strong>Flood</strong>wall_Spec.mxd<br />
0 DES BY<br />
DR BY<br />
CHK BY<br />
CJL<br />
CJL<br />
MER<br />
09/30/09<br />
09/30/09<br />
09/10/09<br />
TITLE<br />
<strong>Flood</strong>wall - Slab Portion Cross Section<br />
200 Orchard Ridge Drive<br />
Gaithersburg, MD 20878<br />
PROJ NO<br />
EXHIBIT<br />
2-2<br />
15298592
Exhibit 3: Various <strong>Flood</strong>wall Tables<br />
Tables providing additional data for the floodwall design. Drainage area 1 is 11 acres with a<br />
time <strong>of</strong> concentration <strong>of</strong> 12 minutes. Drainage area 2 is 39 acres with a time <strong>of</strong> concentration <strong>of</strong><br />
16 minutes. Computations for time <strong>of</strong> concentrations are provided as Exhibit 4 in this appendix.<br />
Table 1: Peak discharges and pipe sizes for floodwall drainage area 1<br />
Recurrence Intensity<br />
Diameter <strong>of</strong> the<br />
interval (in/hr) C Q (cfs) Q (gpm) pipe required (ft)<br />
10 year 5.52 0.95 56.4 25,303 2.82<br />
25 year 6.45 0.95 65.8 29,566 2.99<br />
50 year 7.23 0.95 73.8 33,141 3.12<br />
100 year 7.95 0.95 81.2 36,441 3.23<br />
Table 2: Peak discharges and pipe sizes for floodwall drainage area 2<br />
Recurrence Intensity<br />
Diameter <strong>of</strong> the<br />
interval (in/hr) C Q (cfs) Q (gpm) pipe required (ft)<br />
10 year 4.87 0.95 180.8 81,191 4.36<br />
25 year 5.82 0.95 216.1 97,029 4.66<br />
50 year 6.43 0.95 238.8 107,199 4.84<br />
100 year 7.09 0.95 263.3 118,202 5.02<br />
Table 3: <strong>Flood</strong> run<strong>of</strong>f and volume table for floodwall<br />
Recurrence 24-hour Rainfall<br />
Volume<br />
interval<br />
(in) Run<strong>of</strong>f, Q (in) (ac-ft)<br />
10-year 5.13 3.5 14.53<br />
25-year 5.98 4.3 17.85<br />
50-year 7.01 5.3 21.93<br />
100-year 7.96 6.2 25.73
Table 4: Detailed cost estimate for floodwall<br />
Item Description Quantity Unit Unit Price Total<br />
Design<br />
Design 1 LS $1,970,817.72 $ 1,970,818<br />
Permitting 1 LS $1,175,000.00 $ 1,175,000<br />
Subtotal $ 3,145,818<br />
Construction<br />
1 Concrete for base <strong>of</strong> wall 5,426 CY $390.00 $ 2,116,111<br />
2 Concrete for wall (13.2 ft) 2,447 CY $390.00 $ 954,287<br />
3 Concrete for wall (7.2 ft)<br />
Concrete for slabs (Boat<br />
814 CY $390.00 $ 317,460<br />
4 Club to Chart House)<br />
Anchor Bolts, 1.5 ft, 36 in<br />
1,724 CY $450.00 $ 776,000<br />
6 long<br />
Aluminum Planks for<br />
Removable <strong>Flood</strong>wall at<br />
388 each $100.00 $ 38,800<br />
7 road crossings 80 LF $750.00 $ 60,000<br />
8 Removable floodwall base<br />
Pump Stations and<br />
2 each $50,000.00 $ 100,000<br />
7 Features 3 each $1,500,000.00 $ 4,500,000<br />
9 Excavation<br />
Easements (10% <strong>of</strong><br />
8,652 CY $11.05 $ 95,605<br />
10 construction cost) 1 LS $895,826.24 $ 895,826<br />
Subtotal $ 9,854,089<br />
Construction Contingency (20%) $ 1,970,818<br />
Mobilization/Demobilization/Stakeout ($50,000 min or<br />
5%) $ 492,704<br />
TOTAL $15,463,428<br />
Annual Maintenance $3,399,844<br />
Cost used in BCA $18,863,273<br />
Pump Stations and Features include costs for: Dewatering, structural, mechanical, HVAC, Electrical, Communication/Control,<br />
and site work<br />
Mobilization cost also includes erosion and sediment control measures<br />
Permitting costs include natural resources and cultural resources; assumes NEPA review is not required<br />
Design cost is assumed to be 20 percent <strong>of</strong> construction costs (without contingency or mobilization)
Exhibit 1: Retaining Wall Specification
Exhibit 3: Various Elevated Walkway Tables<br />
Tables providing additional data for the 550 foot floodwall and elevated walkway design. The<br />
drainage area for the 500 foot floodwall is 3.5 acres with a time <strong>of</strong> concentration <strong>of</strong> 10 minutes.<br />
The drainage area for the walkway at King Street is 19.1 acres with a time <strong>of</strong> concentration <strong>of</strong> 11<br />
minutes. The drainage area for the walkway at Duke Street is 4 acres with a time <strong>of</strong><br />
concentration <strong>of</strong> 10 minutes. The drainage area for the remainder <strong>of</strong> the walkway is 4.8 acres<br />
with a time <strong>of</strong> concentration <strong>of</strong> 10 minutes. The total drainage area <strong>of</strong> the elevated walkway is<br />
28 acres. Computations for time <strong>of</strong> concentrations are provided as Exhibit 4 in this appendix.<br />
Table 1: Peak discharges and pipe sizes for 550 foot walkway<br />
Recurrence Intensity<br />
Diameter <strong>of</strong> the<br />
interval (in/hr) C Q (cfs) Q (gpm) pipe required (ft)<br />
10-year 5.91 0.95 19.2 8,634 1.88<br />
25-year 6.88 0.95 22.4 10,051 1.99<br />
50-year 7.68 0.95 25.0 11,219 2.08<br />
100-year 8.4 0.95 27.3 12,271 2.15<br />
Table 2: Peak discharges and pipe sizes for walkway at King Street<br />
Recurrence Intensity<br />
Diameter <strong>of</strong> the<br />
interval (in/hr) C Q (cfs) Q (gpm) pipe required (ft)<br />
10-year 5.7 0.95 103.5 46,489 3.54<br />
25-year 6.65 0.95 120.8 54,237 3.75<br />
50-year 7.45 0.95 135.3 60,762 3.91<br />
100-year 8.18 0.95 148.6 66,716 4.05<br />
Table 3: Peak discharges and pipe sizes for walkway at Duke Street<br />
Recurrence Intensity<br />
Diameter <strong>of</strong> the<br />
interval (in/hr) C Q (cfs) Q (gpm) pipe required (ft)<br />
10-year 5.91 0.95 22.7 10,207 2.00<br />
25-year 6.88 0.95 26.5 11,883 2.12<br />
50-year 7.68 0.95 29.5 13,264 2.21<br />
100-year 8.4 0.95 32.3 14,508 2.29<br />
Table 4: Peak discharges and pipe sizes for remainder <strong>of</strong> walkway drainage area<br />
Recurrence Intensity<br />
Diameter <strong>of</strong> the<br />
interval (in/hr) C Q (cfs) Q (gpm) pipe required (ft)<br />
10-year 5.91 0.95 26.8 12,048 2.13<br />
25-year 6.88 0.95 31.2 14,025 2.26<br />
50-year 7.68 0.95 34.9 15,656 2.35<br />
100-year 8.4 0.95 38.1 17,124 2.43
Table 5: <strong>Flood</strong> run<strong>of</strong>f and volume table for elevated walkway<br />
Recurrence 24-hour Rainfall Run<strong>of</strong>f, Q Volume<br />
interval<br />
(in)<br />
(in) (ac-ft)<br />
10-year 5.13 3.5 8.43<br />
25-year 5.98 4.3 10.35<br />
50-year 7.01 5.3 12.72<br />
100-year 7.96 6.2 14.92<br />
Table 6: <strong>Flood</strong> run<strong>of</strong>f and volume table for 550 foot floodwall<br />
Recurrence 24-hour Rainfall Run<strong>of</strong>f, Q Volume<br />
interval<br />
(in)<br />
(in) (ac-ft)<br />
10-year 5.13 3.5 0.99<br />
25-year 5.98 4.3 1.22<br />
50-year 7.01 7.01 1.50<br />
100-year 7.96 7.96 1.76
Table 7: Detailed cost estimate for elevated walkway and 550 foot floodwall<br />
Item<br />
Design<br />
Description Quantity Unit Unit Price Total<br />
Design 1 LS $604,170.85 $ 604,171<br />
Permitting 1 LS $650,000.00 $ 650,000<br />
Subtotal $ 1,254,171<br />
Construction<br />
Concrete for base <strong>of</strong><br />
1 elevated walkway<br />
Concrete for wall <strong>of</strong><br />
521 CY $390.00 $ 203,378<br />
2 elevated walkway<br />
Concrete for base <strong>of</strong> 550<br />
379 CY $390.00 $ 147,911<br />
3 foot floodwall<br />
Concrete for wall <strong>of</strong> 550<br />
130 CY $390.00 $ 50,844<br />
4 foot floodwall<br />
Bituminous Sidewalk, 1" thick<br />
122 CY $390.00 $ 47,667<br />
5 paving, 4" gravel base, 5' width 1,276 LF $8.02 $ 10,234<br />
6 Common earth backfill<br />
Pump Stations and<br />
2,269 CY $13.46 $ 30,541<br />
7 Features 2 each $1,150,000.00 $ 2,300,000<br />
8 42" concrete pipe<br />
Curb inlet frame, grate,<br />
curb box: Large 24" x 36"<br />
1,470 lf $144.00 $ 211,680<br />
9 heavy duty 2 each $1,250.00 $ 2,500<br />
10 Flap Gates 2 each $8,050.00 $ 16,100<br />
11 Excavation<br />
Easements (10% <strong>of</strong><br />
4,067 CY $11.02 $ 44,818<br />
12 construction cost) 1 LS $306,567.26 $ 306,567<br />
Subtotal $ 3,020,854<br />
Construction Contingency (20%) $ 604,171<br />
Mobilization/Demobilization/Stakeout ($50,000 min or<br />
5%) $ 151,043<br />
TOTAL $ 5,030,239<br />
Annual Maintenance $1,042,251<br />
Cost used in BCA $ 6,072,490
Exhibit 4-1: 550 foot <strong>Flood</strong>wall
Exhibit 4-2: Elevated Walkway - King Street
Exhibit 4-3: Elevated Walkway - Prince Street
Appendix H<br />
Berm
Various Jones Point Berm Tables<br />
Tables providing additional data for the Jones Point Berm design. Drainage Area 1 is 3.5 acres<br />
and Drainage Area 2 is 3.2 acres. A time <strong>of</strong> concentration <strong>of</strong> 5 minutes was assumed for both<br />
areas.<br />
Table 1: Stage-Storage information for Drainage Area 2<br />
Elevation<br />
(ft)<br />
Area<br />
(sq ft)<br />
Area<br />
(ac)<br />
Average<br />
Area (ac)<br />
Depth (ft)<br />
Interval<br />
Storage (ac-ft)<br />
Cumulative<br />
Storage (ac-ft)<br />
6 4,780 0.110 0.000<br />
0.218 2.00 0.437<br />
8 14,249 0.327 0.437<br />
0.457 2.00 0.915<br />
10 25,604 0.588 1.352<br />
Table 2: Peak discharges and pipe sizes for berm drainage area 1<br />
Recurrence 24-hour Rainfall Run<strong>of</strong>f, Q Volume<br />
interval<br />
(in)<br />
(in) (ac-ft)<br />
10-year 5.13 3.5 1.02<br />
25-year 5.98 4.3 1.25<br />
50-year 7.01 5.3 1.53<br />
100-year 7.96 6.2 1.80<br />
Table 3: Peak discharges and pipe sizes for berm drainage area 2<br />
Recurrence 24-hour Rainfall Run<strong>of</strong>f, Q Volume<br />
interval<br />
(in)<br />
(in) (ac-ft)<br />
10-year 5.13 3.5 0.93<br />
25-year 5.98 4.3 1.14<br />
50-year 7.01 5.3 1.40<br />
100-year 7.96 6.2 1.65
Table 4: Detailed cost estimate for berm<br />
Item Description Quantity Unit Unit Price Total<br />
Permitting<br />
Design 1 LS $534,233.94 $ 534,234<br />
Permitting 1 LS $210,000.00 $ 210,000<br />
Subtotal $ 744,234<br />
Construction<br />
1 Common Earth 12,786 CY $13.45 $ 171,972<br />
2 Clay Fill 2,538 CY $21.00 $ 53,298<br />
3<br />
Curb Inlet frame, grate, curb box:<br />
Large 24" x 36" heavy duty 4 each $1,250.00 $ 5,000<br />
4 36" concrete pipe 400 LF $112.00 $ 44,800<br />
5 48" concrete pipe 450 LF $189.00 $ 85,050<br />
6 36" aluminum flap gates 2 each $5,525.00 $ 11,050<br />
7 Pump Station and Features 2 each $1,150,000.00 $2,300,000<br />
Subtotal $2,671,170<br />
Construction Contingency (20%) $ 534,234<br />
Mobilization/Demobilization/Stakeout ($50,000 min or<br />
5%) $ 133,558<br />
TOTAL $4,083,196<br />
Annual Maintenance $1,408,779<br />
Cost used in BCA $5,491,975<br />
Pump Stations and Features include costs for: Dewatering, structural, mechanical, HVAC, Electrical, Communication/Control,<br />
and site work<br />
Mobilization cost also includes erosion and sediment control measures<br />
Permitting costs include natural resources and cultural resources<br />
Design cost is assumed to be 20 percent <strong>of</strong> construction costs (without contingency or mobilization)
Appendix I<br />
Roadway Drainage
Roadway Drainage Additional Data<br />
Table 1: Detailed cost estimate for roadway and inlet improvements<br />
Item Description Quantity Unit Unit Price Total<br />
Design<br />
Design 1 LS $56,523.78 $ 56,524<br />
Permitting 1 LS $120,000 $120,000<br />
Subtotal $176,524<br />
Construction<br />
Pavement Removal,<br />
bituminous roads, 4" to 6"<br />
1 thick 2,633 SY $7.90 $ 20,801<br />
2 Grading Subgrade for base course<br />
Asphaltic Concrete Pavement,<br />
2,633 SY $0.42 $ 1,106<br />
3 Binder, coarse, 4" thick<br />
Common Earth fill (for road<br />
2,633 SY $15.54 $ 40,917<br />
4 elevation)<br />
Cement Concrete Curb and<br />
Gutter, steel forms, 6"x18",<br />
3,950 CY $13.45 $ 53,128<br />
4 straight<br />
Manhole/inlet frames and<br />
covers, including row <strong>of</strong><br />
1,220 LF $9.90 $ 12,078<br />
5 brick, concrete collar<br />
Storm Drainage Manholes,<br />
Frames and Covers, Brick 4'<br />
8 each $265 $ 2,120<br />
6 deep<br />
Brick Paving for sidewalk<br />
8 each $1,325 $ 10,600<br />
6 replacement 6,100 SF $12.10 $ 73,810<br />
7 Trench Drain 83 LF $820 $ 68,060<br />
Subtotal $282,619<br />
Construction Contingency (20%) $ 56,524<br />
Mobilization/Demobilization/Stakeout<br />
($50,000 min or 5%) $ 50,000<br />
TOTAL $565,666<br />
Annual Maintenance<br />
Cost used in BCA $565,666<br />
Permitting costs include natural resources and cultural resources.<br />
Mobilization cost also includes erosion and sediment control measures.<br />
Design cost is assumed to be 20 percent <strong>of</strong> construction costs (without contingency or mobilization).
Figure 1: USGS Gage Data
Appendix J<br />
Property Acquisition
Exhibit 1. Additional Costs for Acquisition<br />
Administrative Costs for each Focus Area<br />
The Administrative costs were based on a sliding scale provided by the FEMA Property<br />
Acquisition Handbook, as shown in Figures 1 and 2 below. They include the<br />
extraordinary costs the community may incur to administer funding, such as the cost <strong>of</strong><br />
preparing reports, overtime, and incidental expenses.<br />
Figure 1:<br />
Figure 2:<br />
1
Appraisals<br />
Based on data from AppraiserUniverse.com, residential appraisals in Virginia are $350<br />
on average.<br />
An average <strong>of</strong> $3500 was used for the commercial calculations based on a phone call to<br />
Northern Virginia Appraisal Services.<br />
Property Survey<br />
Based on information from a CNNMoney.com article, property surveys will typically<br />
cost between $500 and $1500. Property surveys may be more costly for larger properties.<br />
We used $250 for residential properties and $3500 for commercial properties in our cost<br />
estimates.<br />
Closing<br />
Based on information from various real estate websites, closing costs in Virginia are<br />
between 2-3% <strong>of</strong> the property sale price, so 2.5% was used in our computations.<br />
http://www.zimbio.com/Real+Estate/articles/414/Purchaser+Closing+Costs+Virginia<br />
Demolition<br />
Demolition fees for structures in Virginia average between $6 and $15 per square foot. If<br />
asbestos is present, demolition will be an additional $2-$3 per square foot.<br />
Source: phone calls to Aceco LLC and Demolition Services Inc.<br />
Relocation<br />
Residential: $3,500 per building<br />
Source: phone calls to Jk Moving and Storage, Twins moving and storage<br />
Commercial: $ 121,751<br />
Table 1: Estimate <strong>of</strong> Average Commercial Relocation Expenses<br />
SBA Referenced Example Costs 1 Estimated Costs<br />
Legal/Licenses/Permits $1,000<br />
Printed materials $7,500<br />
Consultants $15,000<br />
Insurance $250<br />
Research and Development $1,000<br />
Expensed Equipment $3,500<br />
Other $5,000<br />
Loss <strong>of</strong> Revenue 2 $32,501<br />
Utility fees $1,000<br />
Additional marketing $5,000<br />
Retr<strong>of</strong>it costs $20,000<br />
Moving Company 3 $30,000<br />
TOTAL $121,751<br />
2
1 The Small Business Administration directs users looking for commercial startup costs to the PaloAlto<br />
Startup Cost Estimator. PaloAlto provided an example <strong>of</strong> startup costs for businesses at the following link:<br />
http://articles.bplans.com/starting-a-business/estimating-realistic-start-up-costs.<br />
2 Loss <strong>of</strong> Revenue assumed average loss <strong>of</strong> business for one week <strong>of</strong> interrupted time.<br />
3 Based on estimate for average commercial area for the project <strong>of</strong> 15215 square feet. Made calls to two<br />
local moving companies using assumption <strong>of</strong> move <strong>of</strong> less than 50 miles on 2nd floor <strong>of</strong> a building without<br />
elevator access. One quote was for $15,000 and another was for $45,000. The average <strong>of</strong> $30,000 was<br />
used.<br />
Please note that the values are only approximate. Most <strong>of</strong> the cost in property acquisition<br />
is the FMV <strong>of</strong> the property.<br />
3
Exhibit 2. Total Other Costs for Property Acquisition<br />
The following tables list the other projects costs (outlined in Exhibit 1) for each study<br />
area. These costs were used to calculate the total cost <strong>of</strong> property acquisition.<br />
Table 1: Jones Point Residential Acquisition Costs<br />
Project Costs<br />
Appraisal 4,550<br />
Relocation Assistance 45,500<br />
Closing 21,059<br />
Demolition 192,083<br />
Property Survey 3,250<br />
Total Project Costs $266,442<br />
Administrative Costs<br />
Project Cost (10,950,643 +<br />
266,422 = $11,217,085) Percent<br />
100,000 0.03 3,000<br />
900,000 0.02 18,000<br />
4,000,000 0.01 40,000<br />
6,217,085 0.005 31,085<br />
Total Administrative Costs $92,085<br />
TOTAL OTHER COSTS $358,527<br />
4
Table 2: King Street Commercial Acquisition Costs<br />
Project Costs<br />
Appraisal 80,500<br />
Relocation Assistance 2,800,273<br />
Closing 2,025,961<br />
Demolition 1,160,880<br />
Property Survey 57,500<br />
Total Project Costs $6,125,114<br />
Administrative Costs<br />
Project Cost (85,319,319<br />
+ 6,125,144 = 91,444,433) Percent<br />
100,000 0.03 3,000<br />
900,000 0.02 18,000<br />
4,000,000 0.01 40,000<br />
86,444,433<br />
Total Administrative<br />
0.005 432,222<br />
Costs $493,222<br />
TOTAL OTHER COSTS $6,618,336<br />
Table 3: King Street Residential Acquisition Costs<br />
Project Costs<br />
Appraisal 1,750<br />
Relocation Assistance 17,500<br />
Closing 107,022<br />
Demolition 76,410<br />
Property Survey 1,500<br />
Total Project Costs $204,182<br />
Administrative Costs<br />
Project Cost (85,319,319 +<br />
204,182 = 85,523,501) Percent<br />
100,000 0.03 3,000<br />
900,000 0.02 18,000<br />
4,000,000 0.01 40,000<br />
80,523,501 0.005 402,618<br />
Total Administrative Costs $463,618<br />
TOTAL OTHER COSTS $667,800<br />
5
Table 4: North Union Acquisition Costs<br />
Project Costs<br />
Appraisal 11,900<br />
Relocation Assistance 119,000<br />
Closing 462,654<br />
Demolition 690,105<br />
Property Survey 8,500<br />
Total Project Costs $1,292,159<br />
Administrative Costs<br />
Project Cost (18,506,176<br />
+ 1,292,159 = 19,798,335) Percent<br />
100,000 0.03 3,000<br />
900,000 0.02 18,000<br />
4,000,000 0.01 40,000<br />
14,798,335<br />
Total Administrative<br />
0.005 73,992<br />
Costs $134,992<br />
TOTAL OTHER COSTS $1,427,151<br />
Table 5: <strong>Waterfront</strong> Commercial Acquisition Costs<br />
Project Costs<br />
Appraisal 77,000<br />
Relocation Assistance 2,678,522<br />
Closing 2,475,027<br />
Demolition 3,974,049<br />
Property Survey 55,000<br />
Total Project Costs<br />
Administrative Costs<br />
$9,259,598<br />
Project Cost (99,001,085<br />
+ 9,259,598 =<br />
108,260,683) Percent<br />
100,000 0.03 3,000<br />
900,000 0.02 18,000<br />
4,000,000 0.01 40,000<br />
103,260,683<br />
Total Administrative<br />
0.005 516,303<br />
Costs $577,303<br />
TOTAL OTHER COSTS $9,836,901<br />
6
Exhibit 3. Method for Calculating the Fair Market Value<br />
Market Data Method or sales comparison method was used for calculating the Fair<br />
Market Value (FMV). The market data estimate <strong>of</strong> FMV is obtained by comparing the<br />
subject property with “comparable” properties that have been sold. The properties need to<br />
have similar location, physical features, condition, etc. in order to be suitable to use to<br />
obtain an accurate FMV.<br />
The following data was collected from http://realestate.alexandriava.gov<br />
1. Assessed Land Value [Land_Value]<br />
2. Assessed Building Value [Building_Value]<br />
3. Sale Date [Sale_Date]<br />
4. Sale Price [Sale_Price]<br />
5. Assessed Value at time <strong>of</strong> the sale - up to year 2000 [Ass_at_sal]<br />
6. Year Build [Year_Built]<br />
7. Construction Quality [Constr_Quality]<br />
8. Story [Story]<br />
9. Ext. Wall Construction[Ext_Wall]<br />
10. Above Grade Living Area (Does not include basement area) [BLDGSF]<br />
11. Total Basement Area [Bsm_A_sqf]<br />
Data was collected for 55 commercial and 395 Residential units. Most <strong>of</strong> these properties<br />
were within the 100-year floodplain; however, data collection also included additional<br />
buildings just outside the floodplain that were connected to a row house or part <strong>of</strong> the<br />
same complex that were within the floodplain. This was important to increase the<br />
accuracy. Some <strong>of</strong> the row townhouses were studied as one unit.<br />
Method for calculating the RATIO.<br />
RATIO = Average(Sale Price/Assessed Value at time <strong>of</strong> sale)<br />
The ratio that was used for the FMV was based on available sales data since 2000.<br />
Usually the last 12 months sales data is used when using the Market Data Method.<br />
However because <strong>of</strong> the limitation on the available sales prices and an extreme market<br />
situation, an average ratio was used which is a more conservative estimate than the past<br />
twelve month ratio.<br />
Method for Calculating the FMV<br />
FMV = (Property OR Building Value)*RATIO<br />
NOTE: For acquisition the price for the land and building (property) was used, while for DDV only the<br />
building price was used.
Appendix K<br />
<strong>Flood</strong>pro<strong>of</strong>ing
Exhibit 1. <strong>Flood</strong>pro<strong>of</strong>ing Cost Estimates<br />
<strong>Flood</strong> Gate<br />
Price quotes from DoorDam’s website, http://www.doordam.com/, show floodgates priced from<br />
$500-$700 dollars. Therefore, the average price for a floodgate was estimated to be $600.<br />
<strong>Flood</strong>pro<strong>of</strong> Doors<br />
Price quotes from <strong>Flood</strong>Guard UK’s website, http://www.floodguarduk.co.uk/en-us/front.html,<br />
showed floodpro<strong>of</strong> doors to cost approximately 4,500 pounds or about $7,000.<br />
Raising the Lowest Adjacent Grade (LAG)<br />
RSMeans 2009 was used to estimate the cost for raising the LAG. This price included cost and<br />
labor for fill placement and rebuilding a surface if necessary (i.e. patio or driveway). The fill<br />
costs were based on the estimate <strong>of</strong> 300 cubic yards <strong>of</strong> clay soil, which would be about $1,100.<br />
The rebuild price was estimated to be about $4,200. Therefore the total cost for raising the LAG<br />
was estimated to be about $5,300.<br />
Internal Elevation<br />
Price quotes from Access Floor System’s website, http://www.accessfloorsystems.com/, were<br />
used to estimate the cost for internal elevation. The website has a tool that provides a price<br />
estimate based on the square footage, height <strong>of</strong> elevation, and materials used. Two focus areas,<br />
King Street and <strong>Waterfront</strong>, have structures that were considered for internal elevation. Separate<br />
price estimates were generated for each <strong>of</strong> the focus areas, using the average square footage from<br />
the GIS data provided by the <strong>City</strong>. The structures where internal elevation is considered in the<br />
King Street focus area have an average area <strong>of</strong> about 3,600 square feet. This resulted in a price<br />
estimate <strong>of</strong> approximately $69,700 per structure for internal elevation in the King Street focus<br />
area. The structures where internal elevation is considered in the <strong>Waterfront</strong> focus area have an<br />
average area <strong>of</strong> about 24,500 square feet. This resulted in a price estimate <strong>of</strong> approximately<br />
$430,500 per structure for internal elevation in the <strong>Waterfront</strong> focus area.<br />
Cost Benefit Ratio<br />
In an effort to make sure the costs for floodpro<strong>of</strong>ing are not underestimated in the BCR<br />
calculations, the price estimates were all increased by 50 percent to account for shipping,<br />
installation, and any other unforeseen costs. The price estimates used are shown in Table 1<br />
below.<br />
Table 1: Price Estimates for <strong>Flood</strong>pro<strong>of</strong>ing Measures<br />
Method Cost per Unit<br />
<strong>Flood</strong> Gate $900.00<br />
Flodpro<strong>of</strong> Door $10,000.00<br />
Raise Patio / Fill $8,000.00<br />
Internal Elevation (King Street) $104,580.00<br />
Internal Elevation (<strong>Waterfront</strong>) $645,688.50
Exhibit 2. Window Replacement Costs<br />
Cost estimates were derived for window replacements in historic <strong>Alexandria</strong> from the<br />
Fairfax Glass Company <strong>of</strong> Falls Church, Virginia and the American Housing Contractor<br />
<strong>of</strong> Fairfax, Virginia. Both estimates were based on the type <strong>of</strong> material used (wood or<br />
aluminum) and whether or not a true replication <strong>of</strong> the existing window is required.<br />
Considering that windows should meet historic district criteria, the conservative cost<br />
estimate <strong>of</strong> window replacement received was approximately $100 per square foot. To<br />
calculate the estimated price <strong>of</strong> window replacements, average window size, sales tax and<br />
any contingencies during installation were considered.<br />
For residential properties, colonial windows with dimensions <strong>of</strong> 6 feet x 4 feet at $100<br />
per square foot for a 24 square foot window, the cost <strong>of</strong> one colonial window is $2,400.<br />
With a five percent sales tax and accounting for 20 percent for contingencies, the total<br />
cost is approximately $3,000 per residential window.<br />
Because commercial windows are larger and may be more difficult to replace,<br />
commercial windows were assumed to be twice as expensive as residential. Therefore,<br />
window replacement for commercial properties in the historic district is approximately<br />
$6,000 per window.<br />
Another option besides replacing historic windows would be to modify existing windows<br />
using secondary glazing and caulking. This method is designed to stop water penetration.<br />
It meets the historical requirements in <strong>Alexandria</strong> and does not affect the window<br />
appearance. The cost <strong>of</strong> secondary glazing for windows is between $300 and $400,<br />
depending on window size.<br />
Window replacement is suggested instead <strong>of</strong> window shields to preserve the aesthetics <strong>of</strong><br />
the historic district. Window replacement prices will vary based on size and<br />
specifications. Windows should be appropriate to the historic period and architectural<br />
style <strong>of</strong> the building. Specific information on acceptable window types can be found in<br />
the <strong>City</strong> <strong>of</strong> <strong>Alexandria</strong>’s Design Guidelines for the Old and Historic <strong>Alexandria</strong> District<br />
and the Parker-Gray District.<br />
References:<br />
Buck Schuckman from Fairfax Glass Company. Falls Church, VA. 703-560-1140<br />
Danny Kim from American Housing Contractor (Marvin Windows). Fairfax, VA. 703-<br />
293-6393<br />
Nick Kalivretenos. The Window Man. 703-932-7220. 3000 Jefferson Davis Hwy.<br />
<strong>Alexandria</strong>, Virginia 22305<br />
Design Guidelines for the Old and Historic <strong>Alexandria</strong> District and the Parker-Gray<br />
District, <strong>City</strong> <strong>of</strong> <strong>Alexandria</strong>, Virginia, Department <strong>of</strong> Planning and Community<br />
Development.<br />
Mon-Ray Inc, Storm Window Search, Accessed September 2009<br />
http://www.monray.com/mr500.htm
Exhibit 3. FEMA guidance on floodpro<strong>of</strong>ing utility systems.<br />
You Can <strong>Flood</strong>pro<strong>of</strong> Your Utility Systems Before Disaster Strikes<br />
Release Date: October 23, 2006<br />
Release Number: 1661-010<br />
GLEN ALLEN, VA -- If you aren’t located in a flood zone, you may think you don’t<br />
have to worry about protecting your home or business against flood damage. But, Mother<br />
Nature would tell you otherwise. Nearly a quarter <strong>of</strong> National <strong>Flood</strong> Insurance (NFIP)<br />
claims come from areas that aren’t considered at high risk for flooding.<br />
The Federal Emergency Management Agency (FEMA) has information for both home<br />
and business property owners on how to floodpro<strong>of</strong> electrical, plumbing and heating<br />
systems.<br />
“Before they begin, property owners must call their local planning commission to get the<br />
base flood-elevation levels for their location,” said Gracia Szczech, FEMA’s federal<br />
coordinating <strong>of</strong>ficer for recovery operations. “Specific rules apply based on your<br />
community’s risk for floods.”<br />
Advice for property owners is available on FEMA’s web site, www.floodsmart.gov, that<br />
will save you money and, in the long run, help keep your home or business safe.<br />
“The first and most important thing a property owner should do is elevate electrical and<br />
heating systems 12 inches above the height water would reach during a 100-year flood<br />
event or the highest known flood levels for the area,” said Michael Cline, the state<br />
coordinating <strong>of</strong>ficer. “That information is available from your local planning commission<br />
<strong>of</strong>fice, and making use <strong>of</strong> it could save you a lot <strong>of</strong> money and inconvenience in the<br />
future.”<br />
Below are other important safety measures to take before the next flood:<br />
Electrical and Heating Systems<br />
Elevate all outlets, switches, light sockets and junction boxes, as well as the main<br />
breaker or fuse box and electric motors. Junctions should be located in approved<br />
junction boxes with the 100-year rule in mind.<br />
Run wires overhead. If they have to be in areas where they could get wet, use a<br />
wire rated for underground use.<br />
Elevate electric baseboard heater systems. For the wall area below the baseboard<br />
units, use waterpro<strong>of</strong> wall construction materials and techniques.
Elevate or relocate the electric panel with the 100-year rule in mind. The<br />
maximum panel height is regulated by the code. Check with your local county<br />
commission <strong>of</strong>fice for the maximum height that applies to your community.<br />
Elevate or relocate the heating unit. Consider installing utilities on the second<br />
floor or in the attic. If you are replacing your furnace, ask the supplier for<br />
information about a downdraft system.<br />
You can also consider suspending the heating system, making sure it is 12 inches<br />
above the highest flood levels.<br />
Elevate your air conditioner or heat pump on masonry, concrete or pressuretreated<br />
lumber base at least 12 inches above the highest flood levels.<br />
Anchor your fuel tank. Unanchored fuel tanks can tip over or float, and escaping<br />
fuel may result in spills or fires. Use non-corrosive metal structural supports and<br />
fasteners. Check with the fuel tank manufacturer for recommendations since the<br />
type <strong>of</strong> anchorage, including slab dimensions, varies depending on tank size.<br />
Keep the tank topped <strong>of</strong>f to reduce its tendency to float.<br />
Appliances<br />
Elevate a basement-level washer and dryer on a masonry or pressure treated<br />
lumber base to at least 12 inches above the highest flood levels.<br />
Relocate the washer and dryer to a higher floor in the home.<br />
Elevate or relocate the water heater to at least 12 inches above the highest flood<br />
levels.<br />
When making repairs or putting up a building, you should always check with the local<br />
planning commission, local building <strong>of</strong>ficial or floodplain administrator to make sure you<br />
are following local zoning regulations and state and local building codes. Damaged<br />
properties should be checked before any work, since repairs to very badly damaged<br />
buildings are not permitted.<br />
Be sure you have all the necessary permits before any work begins. Electrical wiring has<br />
to be done by a licensed electrician and approved by the building department.<br />
For more information on how to protect your home, call FEMA publications at 1-800-<br />
480-2520 and ask for booklet F-0206, Coping With a <strong>Flood</strong>; Before, During and After.<br />
FEMA manages federal response and recovery efforts following any national incident,<br />
initiates mitigation activities and manages the National <strong>Flood</strong> Insurance Program. FEMA<br />
works closely with state and local emergency managers, law enforcement personnel,<br />
firefighters and other first responders. FEMA became part <strong>of</strong> the U.S. Department <strong>of</strong><br />
Homeland Security on March 1, 2003.<br />
Source: http://www.fema.gov/news/newsrelease.fema?id=30984
Appendix L<br />
Potential Federal Funding Options
Overview<br />
Potential Federal Funding Options<br />
A number <strong>of</strong> the flood mitigation activities recommended in the <strong>Potomac</strong> River <strong>Waterfront</strong><br />
<strong>Flood</strong> <strong>Mitigation</strong> <strong>Study</strong> carry significant capital improvement costs and operation and<br />
maintenance expenditures. Available funding sources include:<br />
Government Grants<br />
Revenue Bonds<br />
Enterprise Funds<br />
Special Purpose Local Option Sales Taxes<br />
State Revolving Fund Loans<br />
Impact Fees<br />
Special Assessments<br />
There are several Federal grants that may be appropriate with the mitigation measures<br />
recommended in this <strong>Potomac</strong> River <strong>Waterfront</strong> <strong>Flood</strong> <strong>Mitigation</strong> <strong>Study</strong>. Information regarding<br />
these grants can be accessed in a variety <strong>of</strong> ways.<br />
As part <strong>of</strong> the Federal government’s E-Grants Initiative the Grants.gov Web site:<br />
http://www.grants.gov/ is a central repository and clearinghouse for over 1,000 grants with over<br />
$500 billion in awards per year. Through Grants.gov over 300,000 applications were submitted<br />
in fiscal year 2009. Grants.gov provides a grants search engine with several search categories<br />
including agency name or funding activities. The most appropriate grants for flood mitigation are<br />
those administered by FEMA’s Hazard <strong>Mitigation</strong> Assistance (HMA) grant programs.<br />
FEMA has detailed descriptions <strong>of</strong> each <strong>of</strong> its HMA grant programs on its Web site<br />
http://www.fema.gov/government/grant/hma/index.shtm. However, since applications for these<br />
programs are submitted through individual State governments, it is required that the <strong>City</strong> <strong>of</strong><br />
<strong>Alexandria</strong> coordinate with the Virginia Department <strong>of</strong> Emergency Management (VDEM) when<br />
preparing HMA grant applications. It is important to note that, in addition to FEMA deadlines,<br />
VDEM has its own internal deadlines for the acceptance <strong>of</strong> grant applications. VDEM provides<br />
information on grant opportunities on its Web site, including an E-mail alert service to receive<br />
Grant Alerts http://www.vaemergency.com/grants/index.cfm.<br />
While there are numerous grant options, eligibility requirements can restrict the types <strong>of</strong> funding<br />
mechanisms available to the <strong>City</strong>. Some common eligibility restrictions include:<br />
Grants by invitation only (e.g., Economic Development Initiative—Special Project )<br />
Open only to rural communities or disadvantaged populations<br />
Participation in the National <strong>Flood</strong> Insurance Program (NFIP)<br />
Inclusion in a recent Presidential major disaster declaration that is still open
Hazard <strong>Mitigation</strong> Assistance (HMA) Grant Programs<br />
Under the Department <strong>of</strong> Homeland Security (DHS), FEMA oversees HMA grant programs. The<br />
five different HMA programs are listed below with the associated Catalog <strong>of</strong> Federal Domestic<br />
Assistance (CFDA) numbers.<br />
Hazard <strong>Mitigation</strong> Grant Program (HMGP) – CFDA 97.039<br />
Pre-disaster <strong>Mitigation</strong> (PDM) – CFDA 97.047<br />
<strong>Flood</strong> <strong>Mitigation</strong> Assistance (FMA) – CFDA 97.029<br />
Repetitive <strong>Flood</strong> Claims (RFC) – CFDA 97.092<br />
Severe Repetitive Loss (SRL) – CFDA 97.110<br />
The FEMA brochure included in this appendix provides an overview <strong>of</strong> each program including<br />
cost share requirements, subapplicant eligibility, available funding, eligible activities,<br />
management costs, and general requirements.<br />
The PDM, FMA, RFC, and SRL programs are subject to the availability <strong>of</strong> appropriation<br />
funding. The HMA Unified Guidance for Fiscal Year 2011 (FY11) was released on June 1, 2010.<br />
The application period for PDM, FMA, RFC and SRL is June 1, 2010, to December 3, 2010.<br />
FEMA intends to report projects identified for further review in March 2011. During that time<br />
the <strong>City</strong> <strong>of</strong> <strong>Alexandria</strong> must work with VDEM to submit grant applications to FEMA through<br />
eGrants. It is important to note that VDEM has its own internal deadlines for the acceptance <strong>of</strong><br />
grant applications.<br />
HMGP grants can only be sought after a major disaster declaration within the Commonwealth <strong>of</strong><br />
Virginia. FEMA posts disaster declarations at http://www.fema.gov/news/disasters.fema. The<br />
amount <strong>of</strong> funding available to the applicant depends on the funding allocated by FEMA for<br />
disaster recovery under the major disaster declaration. Typically a major disaster declaration is<br />
active for 12 months. As with the other HMA grant programs, the <strong>City</strong> <strong>of</strong> <strong>Alexandria</strong> is required<br />
to coordinate with VDEM to submit an HMGP grant application to FEMA. VDEM has its own<br />
internal deadlines for the acceptance <strong>of</strong> grant applications. As <strong>of</strong> July 2010, the VDEM deadlines<br />
have passed for the three active major disaster declarations. However, major disaster declarations<br />
happen relatively frequently, and the type <strong>of</strong> mitigation measure for which HMGP funding is<br />
sought does not necessarily have to mitigate the effects <strong>of</strong> the hazard that led to the disaster<br />
declaration.<br />
Applicability for the <strong>Potomac</strong> River <strong>Waterfront</strong> <strong>Flood</strong> <strong>Mitigation</strong> <strong>Study</strong><br />
The mitigation measures recommended for the <strong>City</strong> <strong>of</strong> <strong>Alexandria</strong> that may be available for<br />
funding through the HMA programs include the following:<br />
Elevated pedestrian walkway<br />
Dry floodpro<strong>of</strong>ing<br />
Inlet and road elevation improvement<br />
Table 1 summarizes the mitigation measure activities allowed for funding through the abovementioned<br />
programs.
Table 1. HMA Funding Options by Project Type<br />
<strong>Flood</strong> <strong>Mitigation</strong> Project Type HMGP PDM FMA RFC SRL<br />
Dry <strong>Flood</strong>pro<strong>of</strong>ing<br />
Historic residential x x x x x<br />
Non-residential x x x x<br />
Elevated Pedestrian Walkway x x x<br />
Inlet and Road Elevation Improvements x x<br />
In general, HMA funds may be used to pay up to 75 percent <strong>of</strong> the eligible activity costs. The<br />
remaining 25 percent <strong>of</strong> eligible activity costs are derived from non-Federal sources. More<br />
information about each program can be found on the FEMA HMA Web site:<br />
www.fema.gov/government/grant/hma/index.shtm.<br />
Dry <strong>Flood</strong>pro<strong>of</strong>ing<br />
Funding for dry floodpro<strong>of</strong>ing is available under most HMA grant programs. <strong>Flood</strong>pro<strong>of</strong>ing is<br />
typically only allowed for non-residential structures. Historic residential structures may be<br />
considered for dry floodpro<strong>of</strong>ing when other techniques that would mitigate to the BFE would<br />
cause the structure to lose its status. Structures that remain in the Special <strong>Flood</strong> Hazard Area<br />
(SFHA) after the implementation <strong>of</strong> the mitigation project, must maintain flood insurance for the<br />
life <strong>of</strong> the structure.<br />
Elevated Walkway<br />
Localized minor flood reduction projects are fundable under the HMGP, PDM and FMA grant<br />
programs. These projects may include the installation or modification <strong>of</strong> culverts and floodgates,<br />
minor floodwall systems that generally protect an individual structure or facility, stormwater<br />
management activities such as creating retention and detention basins, and the upgrade <strong>of</strong><br />
culverts to bridges. Whereas, major flood control projects related to the construction <strong>of</strong> a<br />
floodwall or seawall are not eligible projects.<br />
The elevated walkway is considered a floodwall. As <strong>of</strong> July 2010, FEMA does not have a<br />
definitive description <strong>of</strong> a large flood control system. However, the elevated walkway proposed<br />
in this study is not a typical mitigation measure. It is a site specific flood barrier and does not<br />
greatly alter the grounds <strong>of</strong> the floodplain or impound water; therefore, there is a chance that it<br />
will be considered a localized minor flood reduction project.<br />
Inlet and Road Elevation Improvements<br />
Raising the road elevations and inlet openings for catch basins would be considered an<br />
infrastructure retr<strong>of</strong>it project, which is eligible for both HMGP and PDM grants. PDM grants can<br />
be pursued through the VDEM application schedule. For an HMGP grant, the <strong>City</strong> could prepare<br />
to apply, but would need to wait for a disaster declaration before it could submit an application to<br />
VDEM and FEMA.<br />
Grant Application Elements<br />
The PDM, FMA, RFC, and SRL applications must be submitted through the eGrants system by<br />
the applicant, generally VDEM, by December 3, 2010, at 3 PM Eastern Time. Prior to the
submission, applicants and subapplicants such as the <strong>City</strong> <strong>of</strong> <strong>Alexandria</strong> are encouraged to work<br />
with their regional FEMA <strong>of</strong>fice to ensure that the application is complete, clear, and appropriate<br />
for the grant program. The application must be cost-effective, technically feasible, effective at<br />
mitigating risk, and able to meet HMA Unified Guidance program requirements including<br />
Environmental Planning and Historic Preservation requirements.<br />
The application should describe the process that the <strong>City</strong> undertook and make a case for the<br />
<strong>City</strong>’s chosen flood mitigation project. A detailed scope <strong>of</strong> work (SOW) provides a clear and<br />
concise means <strong>of</strong> describing the proposed conceptual design and means <strong>of</strong> implementation <strong>of</strong> the<br />
project; it also clearly identifies the risks to be mitigated and the intended project<br />
accomplishments. Future residual risks to the project should also be described. Necessary<br />
documents supporting a SOW include credible sources for the following: assessment <strong>of</strong> past<br />
damages, preliminary design drawings/sketches, FIRMs, and photos. In addition, a work<br />
schedule that identifies all <strong>of</strong> the tasks outlined in the SOW must be included.<br />
Caution must be taken with the application’s cost estimate. It must accurately reflect the SOW<br />
and must include costs associated with mitigating environmental impacts or impacts to historic<br />
properties, appraisal costs, construction demolition, survey, and material disposal costs. The cost<br />
estimate cannot have a line item for contingencies.<br />
A Benefit Cost Analysis (BCA) must be submitted with the application. As the name implies, the<br />
BCA compares the project benefits to the project costs. Project costs include those that are<br />
explained above as well as an estimate for annual maintenance costs. Annual maintenance costs<br />
are not funded by HMA, so they should only be included in the BCA submittal and not in the<br />
application’s cost estimate. Benefits are calculated as avoided damages and losses. The benefit<br />
cost ratio (BCR) is simply the benefit divided by cost and must be equal to or greater than 1.0 to<br />
be eligible for HMA program funds. The BCA must be performed using the FEMA approved<br />
s<strong>of</strong>tware as noted in the most recent HMA Unified Guidance document.
Hazard<br />
<strong>Mitigation</strong><br />
Assistance<br />
The Department <strong>of</strong> Homeland<br />
Security (DHS) Federal Emergency<br />
Management Agency<br />
(FEMA) Hazard <strong>Mitigation</strong><br />
Assistance (HMA) programs<br />
present a critical opportunity<br />
to reduce the risk to individuals<br />
and property from natural<br />
hazards while simultaneously<br />
reducing reliance on Federal<br />
disaster funds.<br />
A COMMON GOAL<br />
While the statutory origins <strong>of</strong><br />
the programs differ, all share<br />
the common goal <strong>of</strong> reducing<br />
the risk <strong>of</strong> loss <strong>of</strong> life and<br />
property due to natural<br />
hazards.<br />
FUNDING DISASTER RECOVERY<br />
EFFORTS<br />
The Hazard <strong>Mitigation</strong> Grant<br />
Program (HMGP) may provide<br />
funds to States, Territories,<br />
Indian Tribal governments,<br />
local governments,<br />
and eligible private non-pr<strong>of</strong>its<br />
following a Presidential major<br />
disaster declaration .<br />
FEMA<br />
Program<br />
Information<br />
<strong>Mitigation</strong><br />
The Unified Hazard <strong>Mitigation</strong> Assistance Grant Programs<br />
Authorities and Purpose<br />
The Hazard <strong>Mitigation</strong> Grant Program (HMGP) is<br />
authorized by Section 404 <strong>of</strong> the Robert T. Staf‐<br />
ford Disaster Relief and Emergency Assistance<br />
Act, as amended (the Stafford Act), Title 42,<br />
United States Code (U.S.C.) 5170c. The key pur‐<br />
pose <strong>of</strong> HMGP is to ensure that the opportunity<br />
to take critical mitigation measures to reduce the<br />
risk <strong>of</strong> loss <strong>of</strong> life and property from future disas‐<br />
ters is not lost during the recon‐<br />
struction process following a dis‐<br />
aster. HMGP is available, when<br />
authorized under the Presidential<br />
major disaster declaration, in the<br />
areas <strong>of</strong> the State requested by<br />
the Governor. The amount <strong>of</strong><br />
HMGP funding available to the<br />
Applicant is based upon the total Federal assis‐<br />
tance to be provided by FEMA for disaster recov‐<br />
ery under the major disaster declaration.<br />
The Pre‐Disaster <strong>Mitigation</strong> (PDM) program is<br />
authorized by Section 203 <strong>of</strong> the Stafford Act, 42<br />
U.S.C. 5133. The PDM program is designed to<br />
assist States, Territories, Indian Tribal govern‐<br />
ments, and local communities to implement a<br />
sustained pre‐disaster natural hazard mitigation<br />
program to reduce overall risk to the population<br />
and structures from future hazard events, while<br />
also reducing reliance on Federal funding from<br />
future major disaster declarations.<br />
The <strong>Flood</strong> <strong>Mitigation</strong> Assistance (FMA) pro‐<br />
gram is authorized by Section 1366 <strong>of</strong> the Na‐<br />
tional <strong>Flood</strong> Insurance Act <strong>of</strong> 1968, as<br />
amended (NFIA), 42 U.S.C. 4104c, with the goal<br />
<strong>of</strong> reducing or eliminating claims under the<br />
National <strong>Flood</strong> Insurance Program (NFIP).<br />
The Repetitive <strong>Flood</strong> Claims (RFC) program is<br />
authorized by Section 1323 <strong>of</strong> the NFIA, 42<br />
U.S.C. 4030, with the goal <strong>of</strong> reducing flood<br />
damages to individual properties for which one<br />
or more claim payments for losses have been<br />
made under flood insurance coverage and that<br />
will result in the greatest savings to the<br />
National <strong>Flood</strong> Insurance Fund (NFIF) in the<br />
shortest period <strong>of</strong> time.<br />
The Severe Repetitive Loss (SRL) program is<br />
authorized by Section 1361A <strong>of</strong> the NFIA, 42<br />
U.S.C. 4102A, with the goal <strong>of</strong> reducing flood<br />
damages to residential properties that have<br />
experienced severe repetitive losses under<br />
flood insurance coverage and that will result in<br />
the greatest amount <strong>of</strong> savings to the NFIF in<br />
the shortest period <strong>of</strong> time.<br />
Additional HMA resources, including the HMA Unified Guidance may be accessed at<br />
www.fema.gov/government/grant/hma/index.shtm
program comparisons<br />
COST SHARE<br />
In general, HMA funds may<br />
be used to pay up to 75 percent<br />
<strong>of</strong> the eligible activity<br />
costs. The remaining 25<br />
percent <strong>of</strong> eligible costs are<br />
derived from non-Federal<br />
sources.<br />
The table to the right outlines<br />
exceptions to the 75<br />
percent Federal and 25 percent<br />
non-Federal share.<br />
ELIGIBLE APPLICANTS<br />
AND<br />
SUBAPPLICANTS<br />
States, Territories, and Indian<br />
Tribal governments are<br />
eligible HMA Applicants.<br />
Each State, Territory, and<br />
Indian Tribal government<br />
shall designate one agency<br />
to serve as the Applicant for<br />
each HMA program.<br />
All interested subapplicants<br />
must apply to the Applicant.<br />
The table to the left identifies,<br />
in general, eligible<br />
subapplicants. For specific<br />
details regarding eligible<br />
subapplicants, refer to 44<br />
CFR Part 206.434(a) for<br />
HMGP and 44 CFR Part<br />
79.6(a) for FMA and SRL.<br />
For HMGP and PDM see 44<br />
CFR Part 206.2(16) for a<br />
definition <strong>of</strong> local governments.<br />
Page 2<br />
Cost Share Requirements<br />
State agencies<br />
Tribal governments<br />
Local governments/communities<br />
Private non‐pr<strong>of</strong>it organizations (PNPs)<br />
Programs <strong>Mitigation</strong> Activity Grant<br />
(Percent <strong>of</strong> Federal/Non‐Federal Share)<br />
HMGP 75/25<br />
PDM 75/25<br />
PDM—subgrantee is small impoverished community 90/10<br />
PDM—Tribal grantee is small impoverished community 90/10<br />
FMA 75/25<br />
FMA—severe repetitive loss property with Repetitive Loss Strategy 90/10<br />
RFC 100/0<br />
SRL 75/25<br />
SRL—with Repetitive Loss Strategy 90/10<br />
Eligible Subapplicants Subapplicant is eligible for program funding<br />
HMGP PDM FMA RFC SRL<br />
Individuals and businesses are not eligible to apply for HMA funds, however, an eligible subapplicant may<br />
apply for funding to mitigate private structures. RFC funds are only available to subapplicants who cannot<br />
meet the cost share requirements <strong>of</strong> the FMA program.<br />
Available Funding<br />
HMA programs are subject to the availability <strong>of</strong> appropriation funding or funding based on disaster<br />
recovery expenditures, as well as any directive or restriction made with respect to such funds.<br />
HMGP funding depends on federal assistance provided for disaster recovery, while PDM, FMA, RFC,<br />
and SRL funding is appropriated annually by Congress.
program comparisons (continued)<br />
ELIGIBLE ACTIVITIES<br />
The table to the right<br />
summarizes eligible activities<br />
that may be funded by<br />
HMA programs. Detailed<br />
descriptions <strong>of</strong> these activities<br />
are found in the HMA<br />
Unified Guidance.<br />
Page 3<br />
Eligible Activities<br />
1. <strong>Mitigation</strong> Projects<br />
Eligible Activities HMGP PDM FMA RFC SRL<br />
Property Acquisition and Structure Demolition or Relocation<br />
Structure Elevation<br />
<strong>Mitigation</strong> Reconstruction<br />
Dry <strong>Flood</strong>pro<strong>of</strong>ing <strong>of</strong> Historic Residential Structures<br />
Dry <strong>Flood</strong>pro<strong>of</strong>ing <strong>of</strong> Non‐residential Structures<br />
Minor Localized <strong>Flood</strong> Reduction Projects<br />
Structural Retr<strong>of</strong>itting <strong>of</strong> Existing Buildings<br />
Non‐structural Retr<strong>of</strong>itting <strong>of</strong> Existing Buildings and Facilities<br />
Safe Room Construction<br />
Infrastructure Retr<strong>of</strong>it<br />
Soil Stabilization<br />
Wildfire <strong>Mitigation</strong><br />
Post‐disaster Code Enforcement<br />
5% Initiative Projects<br />
2. Hazard <strong>Mitigation</strong> Planning<br />
3. Management Costs<br />
<strong>Mitigation</strong> activity is eligible for program funding<br />
Management Costs<br />
For HMGP only: The Grantee may request 4.89 percent <strong>of</strong> HMGP allocation for management costs. The<br />
Grantee is responsible for determining the amount, if any, <strong>of</strong> funds that will be passed through to the<br />
subgrantee(s) for their management costs.<br />
Applicants for PDM, FMA, RFC, or SRL may apply for a maximum <strong>of</strong> 10 percent <strong>of</strong> the total funds<br />
requested in their grant application budget (Federal and non‐Federal shares) for management costs to<br />
support the project and planning subapplications included as part <strong>of</strong> their grant application.<br />
Subapplicants for PDM, FMA, RFC, or SRL may apply for a maximum <strong>of</strong> 5 percent <strong>of</strong> the total funds<br />
requested in a subapplication for management costs.<br />
General Requirements<br />
All mitigation projects must be cost‐effective, be both engineering and technically feasible, and meet<br />
Environmental Planning and Historic Preservation requirements in accordance with HMA Unified<br />
Guidance. In addition, all mitigation activities must adhere to all relevant statutes, regulations, and re‐<br />
quirements including other applicable Federal, State, Indian Tribal, and local laws, implementing regula‐<br />
tions, and Executive Orders.
program information<br />
NFIP INFORMATION<br />
In 1968, Congress created<br />
the National <strong>Flood</strong> Insurance<br />
Program (NFIP) to help provide<br />
a means for property<br />
owners to financially protect<br />
themselves. The NFIP <strong>of</strong>fers<br />
flood insurance to homeowners,<br />
renters, and business<br />
owners if their<br />
community participates in<br />
the NFIP. Participating<br />
communities agree to adopt<br />
and enforce ordinances that<br />
meet or exceed FEMA<br />
requirements to reduce the<br />
risk <strong>of</strong> flooding.<br />
Find out more about the<br />
NFIP and how it can help<br />
you protect yourself.<br />
http://www.floodsmart.gov<br />
MITIGATION ELECTRONIC<br />
GRANTS SYSTEM<br />
For PDM, FMA, RFC, and<br />
SRL, FEMA has developed<br />
a web-based, Electronic<br />
Grants (eGrants) management<br />
system to allow<br />
States, Federallyrecognized<br />
Indian Tribal<br />
governments, territories, and<br />
local governments to apply<br />
for and manage their mitigation<br />
grant application processes<br />
electronically.<br />
Page 4<br />
National <strong>Flood</strong> Insurance Program (NFIP) Participation<br />
NFIP Participation Requirement<br />
There are a number <strong>of</strong> ways that HMA eligibility is related to the NFIP.<br />
Subapplicant eligibility: All subapplicants for FMA, RFC, or SRL must currently be participating in<br />
the NFIP, and not withdrawn or suspended, to be eligible to apply for grant funds. Certain non‐<br />
participating political subdivisions (i.e., regional flood control districts or county governments) may<br />
apply and act as subgrantee on behalf <strong>of</strong> the NFIP‐participating community in areas where the<br />
political subdivision provides zoning and building code enforcement or planning and community<br />
development pr<strong>of</strong>essional services for that community.<br />
Project eligibility: HMGP and PDM mitigation project subapplications for projects sited within a<br />
Special <strong>Flood</strong> Hazard Area (SFHA) are eligible only if the jurisdiction in which the project is located<br />
is participating in the NFIP. There is no NFIP participation requirement for HMGP and PDM<br />
planning subapplications or project subapplications located outside <strong>of</strong> the SFHA.<br />
Property eligibility: Properties included in a project subapplication for FMA, RFC, and SRL funding<br />
must be NFIP‐insured at the time <strong>of</strong> the application submittal. <strong>Flood</strong> insurance must be maintained<br />
at least through completion <strong>of</strong> the mitigation activity.<br />
<strong>Mitigation</strong> Plan Requirement<br />
All Applicants and subapplicants must have hazard mitigation plans meeting the requirements <strong>of</strong> 44<br />
CFR Part 201.<br />
Application Process<br />
Applications for HMGP are processed through the National Emergency Management Information Sys‐<br />
tem (NEMIS). Applicants use the Application Development Module <strong>of</strong> NEMIS, which enables each Appli‐<br />
cant to create project applications and submit them to the appropriate FEMA Region in digital format<br />
for the relevant disaster.<br />
Applications for PDM, FMA, RFC, and SRL are processed through the Electronic Grants (eGrants) sys‐<br />
tem. The eGrants system encompasses the entire grant application process and provides the means to<br />
electronically create, review, and submit a grant application to FEMA via the Internet. Applicants and<br />
subapplicants can access eGrants at https://portal.fema.gov.
program information<br />
GovDelivery Notifications<br />
Stay up to date on the HMA<br />
Grant Programs by subscribing<br />
to GovDelivery notifications.<br />
Have email updates delivered<br />
to an email address or mobile<br />
device.<br />
To learn more visit<br />
www.fema.gov or just click<br />
the icon below.<br />
Page 5<br />
Email Updates<br />
Application Deadline<br />
The PDM, FMA, RFC, and SRL application period is anticipated to be from June 1, 2010, through Decem‐<br />
ber 3, 2010. Applicants must submit an FY11 grant application to FEMA through the eGrants system by<br />
December 3, 2010, at 3:00:00 p.m. Eastern Time.<br />
The HMGP application deadline is 12 months after the date <strong>of</strong> the disaster declaration date and is not<br />
part <strong>of</strong> the annual application period.<br />
Details can be found in the HMA Unified Guidance.<br />
FEMA Review and Selection<br />
All subapplications will be reviewed for eligibility and completeness, cost‐effectiveness, engineering<br />
feasibility and effectiveness, and for Environmental Planning and Historical Preservation compliance.<br />
Subapplications that do not pass these reviews will not be considered for funding.<br />
FEMA will notify Applicants <strong>of</strong> the status <strong>of</strong> their subapplications and will work with Applicants on<br />
subapplications identified for further review.<br />
Contact Information<br />
HMA Helpline: (866) 222‐3580<br />
hmagrantshelpline@dhs.gov<br />
Contact information for FEMA Regional Offices is provided at:<br />
http://www.fema.gov/about/contact/regions.shtm<br />
Contact information for each State Hazard <strong>Mitigation</strong> Officer (SHMO) is provided at:<br />
http://www.fema.gov/about/contact/shmo.shtm<br />
Updated February 2010