Rigorous Sensor Modeling and Triangulation for OrbView-3 - asprs
Rigorous Sensor Modeling and Triangulation for OrbView-3 - asprs
Rigorous Sensor Modeling and Triangulation for OrbView-3 - asprs

You also want an ePaper? Increase the reach of your titles
YUMPU automatically turns print PDFs into web optimized ePapers that Google loves.
triangulation can be per<strong>for</strong>med on multiple images <strong>and</strong> sensors using tie points only in the fully weighted least<br />
squares bundle adjustment.<br />
Automatic Point Measurement (APM) provides a mechanism to measure tie points automatically between<br />
overlapping imagery regardless of the image <strong>for</strong>mat or sensor type. APM was per<strong>for</strong>med on the six input images<br />
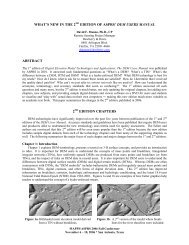
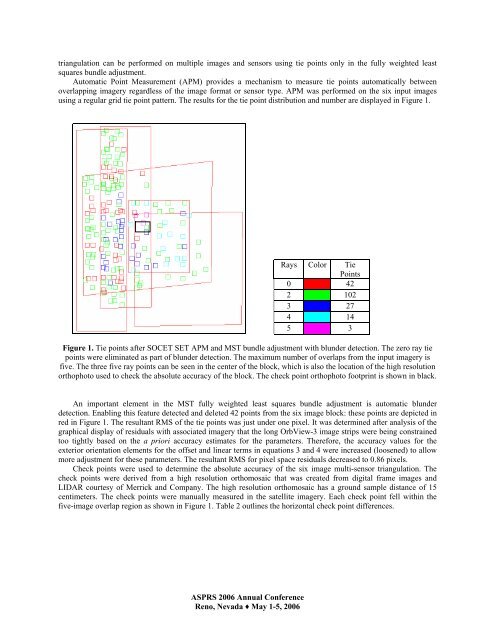
using a regular grid tie point pattern. The results <strong>for</strong> the tie point distribution <strong>and</strong> number are displayed in Figure 1.<br />
Figure 1. Tie points after SOCET SET APM <strong>and</strong> MST bundle adjustment with blunder detection. The zero ray tie<br />
points were eliminated as part of blunder detection. The maximum number of overlaps from the input imagery is<br />
five. The three five ray points can be seen in the center of the block, which is also the location of the high resolution<br />
orthophoto used to check the absolute accuracy of the block. The check point orthophoto footprint is shown in black.<br />
An important element in the MST fully weighted least squares bundle adjustment is automatic blunder<br />
detection. Enabling this feature detected <strong>and</strong> deleted 42 points from the six image block: these points are depicted in<br />
red in Figure 1. The resultant RMS of the tie points was just under one pixel. It was determined after analysis of the<br />
graphical display of residuals with associated imagery that the long <strong>OrbView</strong>-3 image strips were being constrained<br />
too tightly based on the a priori accuracy estimates <strong>for</strong> the parameters. There<strong>for</strong>e, the accuracy values <strong>for</strong> the<br />
exterior orientation elements <strong>for</strong> the offset <strong>and</strong> linear terms in equations 3 <strong>and</strong> 4 were increased (loosened) to allow<br />
more adjustment <strong>for</strong> these parameters. The resultant RMS <strong>for</strong> pixel space residuals decreased to 0.86 pixels.<br />
Check points were used to determine the absolute accuracy of the six image multi-sensor triangulation. The<br />
check points were derived from a high resolution orthomosaic that was created from digital frame images <strong>and</strong><br />
LIDAR courtesy of Merrick <strong>and</strong> Company. The high resolution orthomosaic has a ground sample distance of 15<br />
centimeters. The check points were manually measured in the satellite imagery. Each check point fell within the<br />
five-image overlap region as shown in Figure 1. Table 2 outlines the horizontal check point differences.<br />
ASPRS 2006 Annual Conference<br />
Reno, Nevada ♦ May 1-5, 2006<br />
Rays Color Tie<br />
Points<br />
0 42<br />
2 102<br />
3 27<br />
4 14<br />
5 3