dem users manual - asprs
dem users manual - asprs
dem users manual - asprs

Create successful ePaper yourself
Turn your PDF publications into a flip-book with our unique Google optimized e-Paper software.
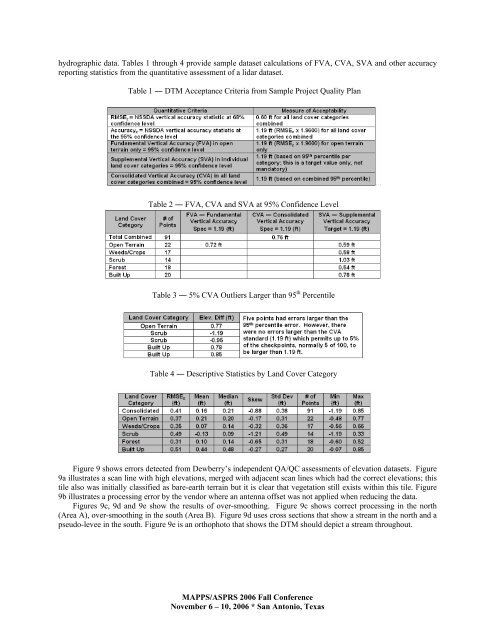
hydrographic data. Tables 1 through 4 provide sample dataset calculations of FVA, CVA, SVA and other accuracy<br />
reporting statistics from the quantitative assessment of a lidar dataset.<br />
Table 1 ― DTM Acceptance Criteria from Sample Project Quality Plan<br />
Table 2 ― FVA, CVA and SVA at 95% Confidence Level<br />
Table 3 ― 5% CVA Outliers Larger than 95 th Percentile<br />
Table 4 ― Descriptive Statistics by Land Cover Category<br />
Figure 9 shows errors detected from Dewberry’s independent QA/QC assessments of elevation datasets. Figure<br />
9a illustrates a scan line with high elevations, merged with adjacent scan lines which had the correct elevations; this<br />
tile also was initially classified as bare-earth terrain but it is clear that vegetation still exists within this tile. Figure<br />
9b illustrates a processing error by the vendor where an antenna offset was not applied when reducing the data.<br />
Figures 9c, 9d and 9e show the results of over-smoothing. Figure 9c shows correct processing in the north<br />
(Area A), over-smoothing in the south (Area B). Figure 9d uses cross sections that show a stream in the north and a<br />
pseudo-levee in the south. Figure 9e is an orthophoto that shows the DTM should depict a stream throughout.<br />
MAPPS/ASPRS 2006 Fall Conference<br />
November 6 – 10, 2006 * San Antonio, Texas