CERN-THESIS-2012-153 26/07/2012 - CERN Document Server
CERN-THESIS-2012-153 26/07/2012 - CERN Document Server
CERN-THESIS-2012-153 26/07/2012 - CERN Document Server
You also want an ePaper? Increase the reach of your titles
YUMPU automatically turns print PDFs into web optimized ePapers that Google loves.
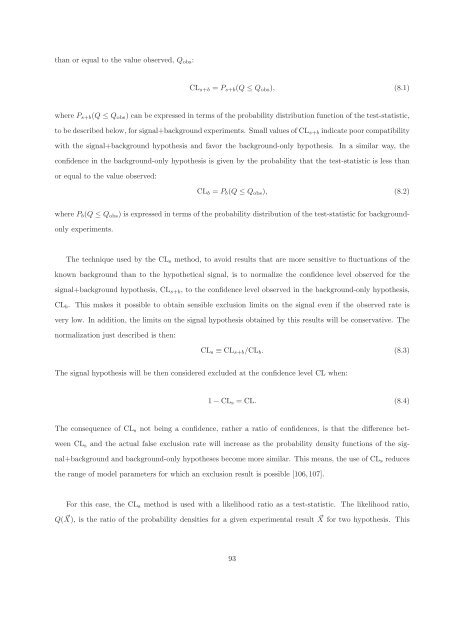
than or equal to the value observed, Qobs:<br />
CLs+b = Ps+b(Q ≤ Qobs), (8.1)<br />
where Ps+b(Q ≤ Qobs) can be expressed in terms of the probability distribution function of the test-statistic,<br />
to be described below, for signal+background experiments. Small values of CLs+b indicate poor compatibility<br />
with the signal+background hypothesis and favor the background-only hypothesis. In a similar way, the<br />
confidence in the background-only hypothesis is given by the probability that the test-statistic is less than<br />
or equal to the value observed:<br />
CLb = Pb(Q ≤ Qobs), (8.2)<br />
where Pb(Q ≤ Qobs) is expressed in terms of the probability distribution of the test-statistic for background-<br />
only experiments.<br />
The technique used by the CLs method, to avoid results that are more sensitive to fluctuations of the<br />
known background than to the hypothetical signal, is to normalize the confidence level observed for the<br />
signal+background hypothesis, CLs+b, to the confidence level observed in the background-only hypothesis,<br />
CLb. This makes it possible to obtain sensible exclusion limits on the signal even if the observed rate is<br />
very low. In addition, the limits on the signal hypothesis obtained by this results will be conservative. The<br />
normalization just described is then:<br />
CLs ≡ CLs+b/CLb. (8.3)<br />
The signal hypothesis will be then considered excluded at the confidence level CL when:<br />
1 − CLs = CL. (8.4)<br />
The consequence of CLs not being a confidence, rather a ratio of confidences, is that the difference bet-<br />
ween CLs and the actual false exclusion rate will increase as the probability density functions of the sig-<br />
nal+background and background-only hypotheses become more similar. This means, the use of CLs reduces<br />
the range of model parameters for which an exclusion result is possible [106,1<strong>07</strong>].<br />
For this case, the CLs method is used with a likelihood ratio as a test-statistic. The likelihood ratio,<br />
Q( X), is the ratio of the probability densities for a given experimental result X for two hypothesis. This<br />
93


