CERN-THESIS-2012-153 26/07/2012 - CERN Document Server
CERN-THESIS-2012-153 26/07/2012 - CERN Document Server
CERN-THESIS-2012-153 26/07/2012 - CERN Document Server

You also want an ePaper? Increase the reach of your titles
YUMPU automatically turns print PDFs into web optimized ePapers that Google loves.
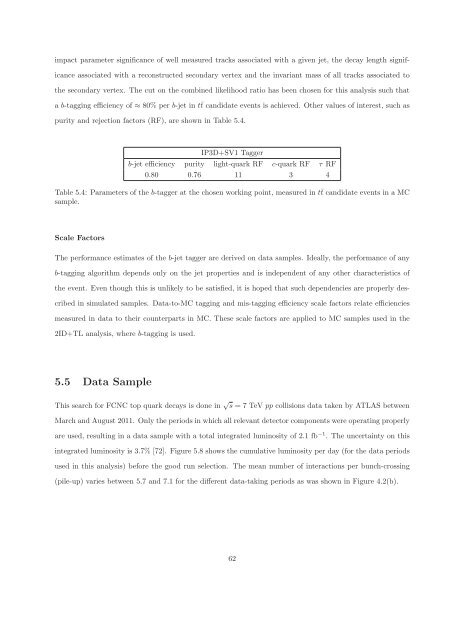
impact parameter significance of well measured tracks associated with a given jet, the decay length signif-<br />
icance associated with a reconstructed secondary vertex and the invariant mass of all tracks associated to<br />
the secondary vertex. The cut on the combined likelihood ratio has been chosen for this analysis such that<br />
a b-tagging efficiency of ≈ 80% per b-jet in t¯t candidate events is achieved. Other values of interest, such as<br />
purity and rejection factors (RF), are shown in Table 5.4.<br />
IP3D+SV1 Tagger<br />
b-jet efficiency purity light-quark RF c-quark RF τ RF<br />
0.80 0.76 11 3 4<br />
Table 5.4: Parameters of the b-tagger at the chosen working point, measured in t¯t candidate events in a MC<br />
sample.<br />
Scale Factors<br />
The performance estimates of the b-jet tagger are derived on data samples. Ideally, the performance of any<br />
b-tagging algorithm depends only on the jet properties and is independent of any other characteristics of<br />
the event. Even though this is unlikely to be satisfied, it is hoped that such dependencies are properly des-<br />
cribed in simulated samples. Data-to-MC tagging and mis-tagging efficiency scale factors relate efficiencies<br />
measured in data to their counterparts in MC. These scale factors are applied to MC samples used in the<br />
2ID+TL analysis, where b-tagging is used.<br />
5.5 Data Sample<br />
This search for FCNC top quark decays is done in √ s = 7 TeV pp collisions data taken by ATLAS between<br />
March and August 2011. Only the periods in which all relevant detector components were operating properly<br />
are used, resulting in a data sample with a total integrated luminosity of 2.1 fb −1 . The uncertainty on this<br />
integrated luminosity is 3.7% [72]. Figure 5.8 shows the cumulative luminosity per day (for the data periods<br />
used in this analysis) before the good run selection. The mean number of interactions per bunch-crossing<br />
(pile-up) varies between 5.7 and 7.1 for the different data-taking periods as was shown in Figure 4.2(b).<br />
62