CERN-THESIS-2012-153 26/07/2012 - CERN Document Server
CERN-THESIS-2012-153 26/07/2012 - CERN Document Server
CERN-THESIS-2012-153 26/07/2012 - CERN Document Server

You also want an ePaper? Increase the reach of your titles
YUMPU automatically turns print PDFs into web optimized ePapers that Google loves.
event kinematics, however no b-jet identification is used. The distributions of the reconstructed mass of the<br />
Z- and W-boson and the two top quarks, this is m reco<br />
ℓaℓb<br />
Figure 5.10.<br />
, mreco<br />
ℓcν , mreco<br />
jbℓcν and mreco respectively, are shown in<br />
jaℓaℓb<br />
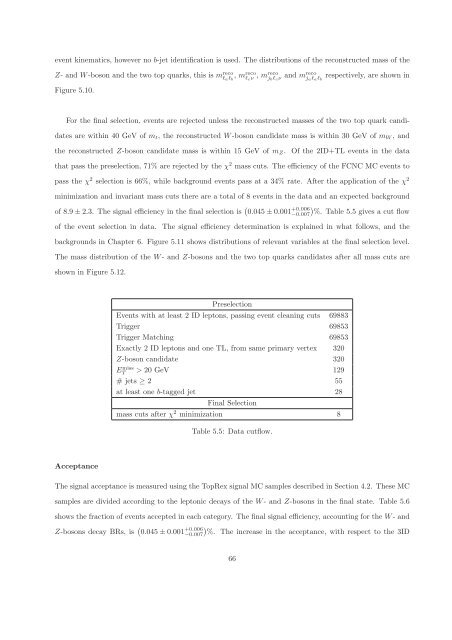
For the final selection, events are rejected unless the reconstructed masses of the two top quark candi-<br />
dates are within 40 GeV of mt, the reconstructed W-boson candidate mass is within 30 GeV of mW, and<br />
the reconstructed Z-boson candidate mass is within 15 GeV of mZ. Of the 2ID+TL events in the data<br />
that pass the preselection, 71% are rejected by the χ 2 mass cuts. The efficiency of the FCNC MC events to<br />
pass the χ 2 selection is 66%, while background events pass at a 34% rate. After the application of the χ 2<br />
minimization and invariant mass cuts there are a total of 8 events in the data and an expected background<br />
of 8.9 ± 2.3. The signal efficiency in the final selection is 0.045 ± 0.001 +0.006<br />
−0.0<strong>07</strong> %. Table 5.5 gives a cut flow<br />
of the event selection in data. The signal efficiency determination is explained in what follows, and the<br />
backgrounds in Chapter 6. Figure 5.11 shows distributions of relevant variables at the final selection level.<br />
The mass distribution of the W- and Z-bosons and the two top quarks candidates after all mass cuts are<br />
shown in Figure 5.12.<br />
Acceptance<br />
Preselection<br />
Events with at least 2 ID leptons, passing event cleaning cuts 69883<br />
Trigger 69853<br />
Trigger Matching 69853<br />
Exactly 2 ID leptons and one TL, from same primary vertex 320<br />
Z-boson candidate 320<br />
E miss<br />
T<br />
> 20 GeV 129<br />
# jets ≥ 2 55<br />
at least one b-tagged jet 28<br />
Final Selection<br />
mass cuts after χ 2 minimization 8<br />
Table 5.5: Data cutflow.<br />
The signal acceptance is measured using the TopRex signal MC samples described in Section 4.2. These MC<br />
samples are divided according to the leptonic decays of the W- and Z-bosons in the final state. Table 5.6<br />
shows the fraction of events accepted in each category. The final signal efficiency, accounting for the W- and<br />
Z-bosons decay BRs, is 0.045 ± 0.001 +0.006<br />
−0.0<strong>07</strong> %. The increase in the acceptance, with respect to the 3ID<br />
66