CERN-THESIS-2012-153 26/07/2012 - CERN Document Server
CERN-THESIS-2012-153 26/07/2012 - CERN Document Server
CERN-THESIS-2012-153 26/07/2012 - CERN Document Server
You also want an ePaper? Increase the reach of your titles
YUMPU automatically turns print PDFs into web optimized ePapers that Google loves.
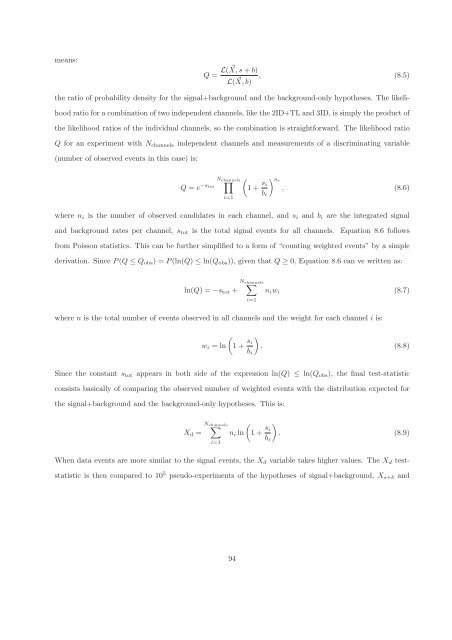
means:<br />
Q = L( X,s + b)<br />
L( , (8.5)<br />
X,b)<br />
the ratio of probability density for the signal+background and the background-only hypotheses. The likeli-<br />
hood ratio for a combination of two independent channels, like the 2ID+TL and 3ID, is simply the product of<br />
the likelihood ratios of the individual channels, so the combination is straightforward. The likelihood ratio<br />
Q for an experiment with Nchannels independent channels and measurements of a discriminating variable<br />
(number of observed events in this case) is:<br />
Q = e −stot<br />
Nchannels <br />
i=1<br />
<br />
1 + si<br />
ni , (8.6)<br />
bi<br />
where ni is the number of observed candidates in each channel, and si and bi are the integrated signal<br />
and background rates per channel, stot is the total signal events for all channels. Equation 8.6 follows<br />
from Poisson statistics. This can be further simplified to a form of “counting weighted events” by a simple<br />
derivation. Since P(Q ≤ Qobs) = P(ln(Q) ≤ ln(Qobs)), given that Q ≥ 0, Equation 8.6 can ve written as:<br />
Nchannels <br />
ln(Q) = −stot +<br />
where n is the total number of events observed in all channels and the weight for each channel i is:<br />
i=1<br />
niwi<br />
(8.7)<br />
<br />
wi = ln 1 + si<br />
<br />
. (8.8)<br />
bi<br />
Since the constant stot appears in both side of the expression ln(Q) ≤ ln(Qobs), the final test-statistic<br />
consists basically of comparing the observed number of weighted events with the distribution expected for<br />
the signal+background and the background-only hypotheses. This is:<br />
Xd =<br />
Nchannels <br />
i=1<br />
<br />
ni ln 1 + si<br />
<br />
. (8.9)<br />
bi<br />
When data events are more similar to the signal events, the Xd variable takes higher values. The Xd test-<br />
statistic is then compared to 10 5 pseudo-experiments of the hypotheses of signal+background, Xs+b and<br />
94


