CERN-THESIS-2012-153 26/07/2012 - CERN Document Server
CERN-THESIS-2012-153 26/07/2012 - CERN Document Server
CERN-THESIS-2012-153 26/07/2012 - CERN Document Server

You also want an ePaper? Increase the reach of your titles
YUMPU automatically turns print PDFs into web optimized ePapers that Google loves.
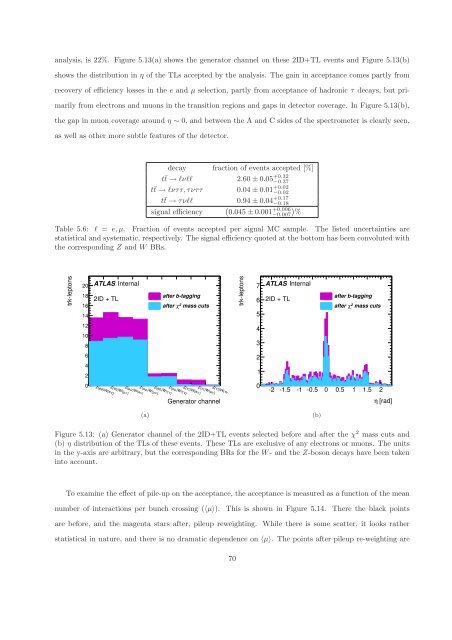
analysis, is 22%. Figure 5.13(a) shows the generator channel on these 2ID+TL events and Figure 5.13(b)<br />
shows the distribution in η of the TLs accepted by the analysis. The gain in acceptance comes partly from<br />
recovery of efficiency losses in the e and µ selection, partly from acceptance of hadronic τ decays, but pri-<br />
marily from electrons and muons in the transition regions and gaps in detector coverage. In Figure 5.13(b),<br />
the gap in muon coverage around η ∼ 0, and between the A and C sides of the spectrometer is clearly seen,<br />
as well as other more subtle features of the detector.<br />
decay fraction of events accepted [%]<br />
t¯t → ℓνℓℓ 2.60 ± 0.05 +0.32<br />
−0.37<br />
t¯t → ℓνττ,τνττ 0.04 ± 0.01 +0.02<br />
−0.02<br />
t¯t → τνℓℓ 0.94 ± 0.04 +0.17<br />
−0.18<br />
+0.006<br />
signal efficiency 0.045 ± 0.001 −0.0<strong>07</strong> %<br />
Table 5.6: ℓ = e,µ. Fraction of events accepted per signal MC sample. The listed uncertainties are<br />
statistical and systematic, respectively. The signal efficiency quoted at the bottom has been convoluted with<br />
the corresponding Z and W BRs.<br />
trkleptons<br />
20<br />
18<br />
16<br />
14<br />
12<br />
10<br />
8<br />
6<br />
4<br />
2<br />
0<br />
ATLAS Internal<br />
2ID + TL<br />
after btagging<br />
after χ2<br />
mass cuts<br />
Z( ττ)W(<br />
τν)<br />
Z( ττ)W(<br />
µ ν)<br />
Z( ττ)W(eν)<br />
Z( µ µ )W( τν)<br />
Z(ee)W( τν)<br />
Z( µ µ )W( µ ν)<br />
Z( µ µ )W(eν)<br />
Z(ee)W( µ ν)<br />
Z(ee)W(eν)<br />
(a)<br />
Generator channel<br />
trkleptons<br />
7<br />
6<br />
5<br />
4<br />
3<br />
2<br />
1<br />
0<br />
ATLAS Internal<br />
2ID + TL<br />
after btagging<br />
after χ2<br />
mass cuts<br />
2 1.5 1 0.5 0 0.5 1 1.5 2<br />
(b)<br />
η [rad]<br />
Figure 5.13: (a) Generator channel of the 2ID+TL events selected before and after the χ 2 mass cuts and<br />
(b) η distribution of the TLs of these events. These TLs are exclusive of any electrons or muons. The units<br />
in the y-axis are arbitrary, but the corresponding BRs for the W- and the Z-boson decays have been taken<br />
into account.<br />
To examine the effect of pile-up on the acceptance, the acceptance is measured as a function of the mean<br />
number of interactions per bunch crossing (〈µ〉). This is shown in Figure 5.14. There the black points<br />
are before, and the magenta stars after, pileup reweighting. While there is some scatter, it looks rather<br />
statistical in nature, and there is no dramatic dependence on 〈µ〉. The points after pileup re-weighting are<br />
70