Modeling Diode Circuits with MicroCap 7.0 - csserver - University of ...
Modeling Diode Circuits with MicroCap 7.0 - csserver - University of ...
Modeling Diode Circuits with MicroCap 7.0 - csserver - University of ...

Create successful ePaper yourself
Turn your PDF publications into a flip-book with our unique Google optimized e-Paper software.
<strong>Modeling</strong> <strong>Diode</strong> <strong>Circuits</strong> <strong>with</strong> <strong>MicroCap</strong> <strong>7.0</strong><br />
Dr. Tony Richardson<br />
Department <strong>of</strong> Electrical Engineering and Computer Science<br />
<strong>University</strong> <strong>of</strong> Evansville<br />
September 2, 2002<br />
Abstract<br />
This tutorial describes how to model diodes using the <strong>MicroCap</strong> <strong>7.0</strong> circuit simulation<br />
program. We will focus on models appropriate for use in DC and low frequency AC<br />
circuits. High frequency models will be the topic <strong>of</strong> a future tutorial.<br />
The basic diode model parameters are first described. We then discuss how to set model<br />
parameters to match a particular diode characteristic curve. Finally we develop<br />
appropriate models for ideal, small-signal, rectifier, LED, and Zener diodes.<br />
<strong>Modeling</strong> the Forward Bias Region<br />
The Basic Model Parameters: LEVEL, IS and N<br />
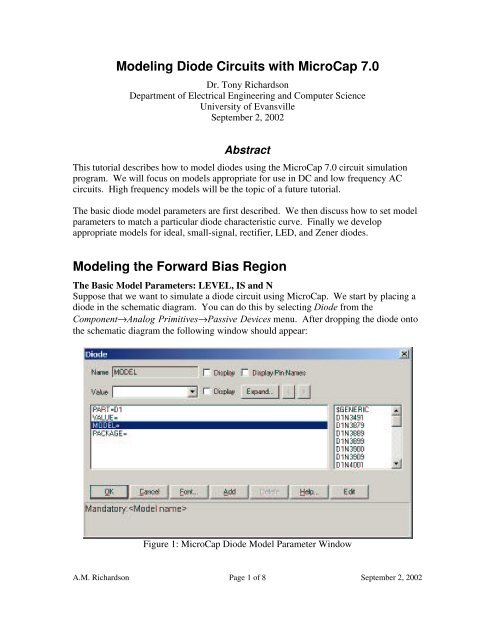
Suppose that we want to simulate a diode circuit using <strong>MicroCap</strong>. We start by placing a<br />
diode in the schematic diagram. You can do this by selecting <strong>Diode</strong> from the<br />
Component→Analog Primitives→Passive Devices menu. After dropping the diode onto<br />
the schematic diagram the following window should appear:<br />
Figure 1: <strong>MicroCap</strong> <strong>Diode</strong> Model Parameter Window<br />
A.M. Richardson Page 1 <strong>of</strong> 8 September 2, 2002
You can select one <strong>of</strong> the standard diode models from the list on the right side <strong>of</strong> the<br />
window. For most <strong>of</strong> our homework and project problems we will want to create our<br />
own diode model. This is easy to do. Just type in a model name. (I will use the name<br />
simple as an example.) Click on the Edit button in the lower right portion <strong>of</strong> the window.<br />
The window should now look like this:<br />
Figure 2: <strong>MicroCap</strong> <strong>Diode</strong> Model Parameter Window<br />
The window now includes a list <strong>of</strong> model parameter files that may be changed as<br />
required. There are over 30 parameters values that may are used in the <strong>MicroCap</strong> diode<br />
model, fortunately only a few <strong>of</strong> these affect the low-frequency behavior <strong>of</strong> the diode.<br />
The complete list <strong>of</strong> parameters is shown in Table 1 on the last page <strong>of</strong> this tutorial.<br />
The three most important parameters to us are the first three shown in Figure 2: LEVEL,<br />
IS, and N. <strong>MicroCap</strong> provides two different diode models. We can select which model<br />
we want to use by setting the value <strong>of</strong> LEVEL. The default value <strong>of</strong> 1 selects the simpler<br />
<strong>of</strong> the two models, but this is a model which is sufficiently accurate for problems which<br />
we will encounter, so leave LEVEL set to 1. IS is the saturation current and N is the<br />
A.M. Richardson Page 2 <strong>of</strong> 8 September 2, 2002
emission coefficient. IS and N appear in the equation describing the ideal diode currentvoltage<br />
relationship:<br />
i D<br />
IS e<br />
v D<br />
N V T ¡ 1<br />
In this equation, vD and iD are the diode voltage and current and VT is the thermal voltage.<br />
(VT = kT/q, k = Boltzmann's constant, T = absolute temperature, and q = the magnitude<br />
<strong>of</strong> the charge on an electron.) At room temperature (T = 300 ºK), VT = 26 mV.<br />
To accurately model an arbitrary diode we just need two points (two iD - vD pairs) from<br />
the forward region <strong>of</strong> the diode characteristic curve. We can then find corresponding<br />
values <strong>of</strong> IS and N from:<br />
N =<br />
v ¡<br />
D2 vD1 V T ln i D2<br />
¢ iD1<br />
¢ v<br />
IS = D1£ N V T iD1 e<br />
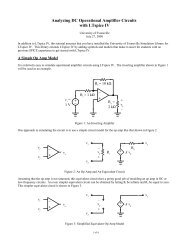
For example, assume we want to model a diode that has a characteristic curve that passes<br />
through the points (0.70 V, 10 mA) and (0.72 V, 20 mA). Using the above formulas<br />
yields:<br />
N = 1.11<br />
IS = 2.91x10 -13 A<br />
The circuit shown in Figure 3 was simulated using <strong>MicroCap</strong>. The values <strong>of</strong> N and IS<br />
just found were used in the diode model. All other parameters were left set to their<br />
default values. Figure 4 shows a plot <strong>of</strong> the diode current versus the diode voltage as the<br />
source voltage is swept from 0 V to 50 V.<br />
Figure 3: <strong>MicroCap</strong> Simple <strong>Diode</strong> Test Circuit<br />
We can see from Figure 4 that the simulated current-voltage characteristic passes through<br />
the same two points as the characteristic curve we are modeling.<br />
A.M. Richardson Page 3 <strong>of</strong> 8 September 2, 2002
Figure 4: <strong>MicroCap</strong> Simple <strong>Diode</strong> Test Results<br />
<strong>Modeling</strong> the Reverse Bias Region<br />
The Reverse Breakdown Parameters: BV and IBV<br />
The default reverse breakdown (Zener) voltage is infinite. Obviously we need to change<br />
this if we are trying to accurately model a Zener diode. There are two parameters that<br />
need to be set to model the Zener breakdown region: BV is the breakdown voltage and<br />
IBV is current at the breakdown voltage. To model an 8 V Zener diode, typical values<br />
for these parameters might be:<br />
BV = 8 V<br />
IBV = 20 mA<br />
Note that BV is set to a positive value although on a typical characteristic curve the<br />
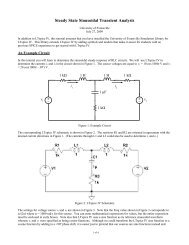
breakdown voltage is negative. These values were used in the diode in Figure 3. A DC<br />
analysis was performed and the source voltage was swept from -60 V to 50 V. Figure 5<br />
shows the result.<br />
A.M. Richardson Page 4 <strong>of</strong> 8 September 2, 2002
Standard <strong>Diode</strong> Models<br />
The Ideal <strong>Diode</strong><br />
Figure 5: <strong>MicroCap</strong> Zener <strong>Diode</strong> Test Results<br />
An ideal diode would have a 0 V knee or threshold voltage. We can find values <strong>of</strong> N and<br />
IS to approximate an ideal diode using the formulas given earlier. Assuming the<br />
approximate ideal characteristic passes through the two points (10 mV, 10 mA) and (20<br />
mV, 2000 mA) the corresponding values <strong>of</strong> N and IS are:<br />
N = 0.072<br />
IS = 5x10 -5 A<br />
Figure 6 shows a circuit in which we compare two half-wave rectifiers. One uses the<br />
simple diode from an earlier circuit and the other uses an "ideal" diode using the values<br />
<strong>of</strong> N and IS from above. The voltage source is a 60 Hz, 5 VPEAK sine wave source.<br />
Figure 7 shows the results. The approximate 0.7 V drop across the simple diode and the<br />
0 V drop across the "ideal" diode during the positive half-cycle <strong>of</strong> the input can clearly be<br />
seen in the figure.<br />
Small Signal <strong>Diode</strong>s<br />
Using the data sheet <strong>of</strong> a 1N4148 diode for data, two points on a typical characteristic<br />
A.M. Richardson Page 5 <strong>of</strong> 8 September 2, 2002
curve are (0.62 V, 1 mA) and (0.70 V, 5 mA). Corresponding values <strong>of</strong> N and IS are:<br />
Rectifying <strong>Diode</strong>s<br />
N = 1.91<br />
IS = 3.83x10 -9 A<br />
Figure 6: <strong>MicroCap</strong> "Ideal" vs Standard <strong>Diode</strong> Test Circuit<br />
Figure 7: <strong>MicroCap</strong> "Ideal" vs Standard <strong>Diode</strong> Test Results<br />
Using the data sheet <strong>of</strong> a 1N4001 diode as representative <strong>of</strong> a rectifying diode, we find:<br />
A.M. Richardson Page 6 <strong>of</strong> 8 September 2, 2002
Light Emitting <strong>Diode</strong>s (LEDs)<br />
N = 2.57<br />
IS = 1.25x10 -6 A<br />
LEDs have greater forward voltage drops than small-signal or rectifying diodes. The<br />
forward voltage drop depends on the color and 2 V is a typically value for red LEDs.<br />
Using (2.0 V, 20 mA) and (2.3 V, 50 mA) as points on the characteristic curve and<br />
calculating N and IS gives:<br />
Zener <strong>Diode</strong>s<br />
N = 12.59<br />
IS = 4.45x10 -5 A<br />
Zener diodes have forward characteristics similar to that <strong>of</strong> a small-signal diode, so use<br />
the same values <strong>of</strong> N and IS as for the small-signal diode. The paramter BV should be<br />
set to the magnitude <strong>of</strong> the zener voltage and IBV should be set to a typical value <strong>of</strong><br />
reverse current (20 mA is <strong>of</strong>ten used on data sheets).<br />
BV = VZ<br />
IBV = 20 mA<br />
A.M. Richardson Page 7 <strong>of</strong> 8 September 2, 2002
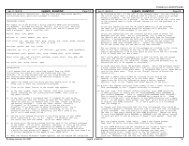
<strong>Diode</strong> Model Parameter Table<br />
Name<br />
Parameter<br />
Units Default Area Level<br />
LEVEL 1=Spice2G 2=PSpice 1<br />
IS Saturation current Amps 1E-14 * 1,2<br />
N Emission coefficient 1.0 1,2<br />
ISR Recombination current parameter Amps 0 * 2<br />
NR Emission coefficient for ISR 2 2<br />
IKF High-injection "knee" current Amps INF * 2<br />
BV Reverse breakdown "knee" voltage Volts INF 1,2<br />
IBV Reverse breakdown "knee" current Amps 1E-10 * 1,2<br />
NBV Reverse breakdown ideality factor 1 2<br />
IBVL Low-level rev. breakdown "knee" current Amps 0 2<br />
NBVL Low-level rev. breakdown ideality factor 1 2<br />
RS Series resistance Ohms 0 / 1,2<br />
TT Transit time sec 0.0 1,2<br />
CJO Zero-bias junction capacitance Farad 0.0 * 1,2<br />
VJ Junction potential Volts 1.0 1,2<br />
M Junction grading coefficient 0.5 1,2<br />
FC Forward bias depletion coefficient 0.5 1,2<br />
EG Energy gap eV 1.11 1,2<br />
XTI Temperature exponent for IS 3.0 1,2<br />
TIKF IKF temperature coefficient (linear) 1/Celsius 0<br />
TBV1 BV temperature coefficient (linear) 1/Celsius 0<br />
TBV2 BV temperature coefficient (quadratic) 1/(Celsius^2) 0<br />
TRS1 RS temperature coefficient (linear) 1/Celsius 0<br />
TRS2 RS temperature coefficient (quadratic) 1/(Celsius^2) 0<br />
KF Flicker noise coefficient 0.0 1,2<br />
AF Flicker noise exponent 1.0 1,2<br />
RL Junction Leakage Resistance Ohms INF 1<br />
T_MEASURED Measured temperature Celsius undefined 1,2<br />
T_ABS Absolute temperature Celsius undefined 1,2<br />
T_REL_GLOBAL Relative to current temperature Celsius undefined 1,2<br />
T_REL_LOCAL Relative to AKO model temperature Celsius undefined 1,2<br />
A.M. Richardson Page 8 <strong>of</strong> 8 September 2, 2002