User manual for Iode - Department of Mathematics
User manual for Iode - Department of Mathematics
User manual for Iode - Department of Mathematics
You also want an ePaper? Increase the reach of your titles
YUMPU automatically turns print PDFs into web optimized ePapers that Google loves.
20 CHAPTER 3. SECOND ORDER LINEAR ODES<br />
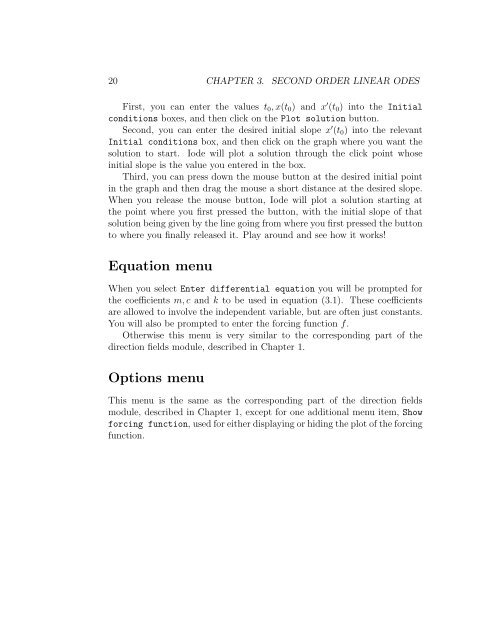
First, you can enter the values t0,x(t0) and x ′ (t0) into the Initial<br />
conditions boxes, and then click on the Plot solution button.<br />
Second, you can enter the desired initial slope x ′ (t0) into the relevant<br />
Initial conditions box, and then click on the graph where you want the<br />
solution to start. <strong>Iode</strong> will plot a solution through the click point whose<br />
initial slope is the value you entered in the box.<br />
Third, you can press down the mouse button at the desired initial point<br />
in the graph and then drag the mouse a short distance at the desired slope.<br />
When you release the mouse button, <strong>Iode</strong> will plot a solution starting at<br />
the point where you first pressed the button, with the initial slope <strong>of</strong> that<br />
solution being given by the line going from where you first pressed the button<br />
to where you finally released it. Play around and see how it works!<br />
Equation menu<br />
When you select Enter differential equation you will be prompted <strong>for</strong><br />
the coefficients m,c and k to be used in equation (3.1). These coefficients<br />
are allowed to involve the independent variable, but are <strong>of</strong>ten just constants.<br />
You will also be prompted to enter the <strong>for</strong>cing function f.<br />
Otherwise this menu is very similar to the corresponding part <strong>of</strong> the<br />
direction fields module, described in Chapter 1.<br />
Options menu<br />
This menu is the same as the corresponding part <strong>of</strong> the direction fields<br />
module, described in Chapter 1, except <strong>for</strong> one additional menu item, Show<br />
<strong>for</strong>cing function, used <strong>for</strong> either displaying or hiding the plot <strong>of</strong> the <strong>for</strong>cing<br />
function.


