User manual for Iode - Department of Mathematics
User manual for Iode - Department of Mathematics
User manual for Iode - Department of Mathematics

You also want an ePaper? Increase the reach of your titles
YUMPU automatically turns print PDFs into web optimized ePapers that Google loves.
22 CHAPTER 4. FOURIER SERIES<br />
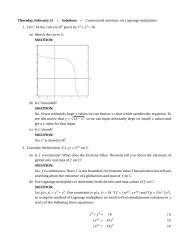
The bottom graph in the window plots the error between the function<br />
f(x) and the partial sum <strong>of</strong> its Fourier series:<br />
error(x) = f(x) −<br />
<br />
A0<br />
2 +<br />
N<br />
(An cos nπx<br />
L + Bn sin nπx<br />
L )<br />
<br />
.<br />
n=1<br />
Notice that the vertical scale on this error plot is generally different from the<br />
scale on the top plot, in which the function is plotted. In fact, the vertical<br />
scale on the error plot will change as you step through the partial sums<br />
(increasing or decreasing the top harmonic).<br />
Across the top <strong>of</strong> both graphs you will find the function written out,<br />
along with the basic period interval x1 ≤ x < x2. The function is extended<br />
periodically by <strong>Iode</strong>, and is shown over two periods.<br />
Controls<br />
• Plot partial sums and errors: plots f and its partial sum in the<br />
top graph, and the error (difference) in the bottom plot.<br />
• Plot coefficients A n and B n: plots the An-coefficients in the top<br />
plot, and the Bn-coefficients in the bottom one, <strong>for</strong> 0 < n < top harmonic.<br />
Notice A0 is never plotted (because it is the least interesting Fourier<br />
coefficient, affecting only how much the graphs are translated up or<br />
down in the y-direction).<br />
• Plot coefficients C n=(A n^2+B n^2)^(1/2): plots the Fourier magnitudes<br />
Cn = A 2 n + B 2 n in the top graph. The bottom graph can be<br />
used to investigate the rate <strong>of</strong> decay <strong>of</strong> the Cn, using an arbitrary comparison<br />
function (see Options below).<br />
• Current top harmonic: increase or decrease this value by clicking on<br />
the “arrow” buttons in the middle <strong>of</strong> the window. (Alternatively, you<br />
can type a number directly into the box between the arrows.) You can<br />
change the top harmonic while in any one <strong>of</strong> the three plotting modes<br />
above.