The Mayor's draft water strategy - london.gov.uk - Greater London ...
The Mayor's draft water strategy - london.gov.uk - Greater London ...
The Mayor's draft water strategy - london.gov.uk - Greater London ...

Create successful ePaper yourself
Turn your PDF publications into a flip-book with our unique Google optimized e-Paper software.
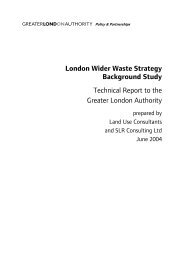
50 <strong>The</strong> Mayor’s <strong>draft</strong> <strong>water</strong> <strong>strategy</strong><br />
activities in the home (right). <strong>The</strong> left-hand<br />
pie chart shows that <strong>water</strong> use in the home<br />
accounts for 89 per cent of all the carbon<br />
emissions resulting from <strong>water</strong> use. Water<br />
abstraction, treatment and supply together<br />
with waste<strong>water</strong> collection and treatment<br />
only accounts for just 11 per cent.<br />
3.35 <strong>The</strong> right-hand pie chart shows that<br />
<strong>water</strong> use accounts for 27 per cent of<br />
carbon emissions from the home. This is<br />
made up of 19 per cent from the heating<br />
of <strong>water</strong> for baths, showers, and hand<br />
washing and washing up. Water-using<br />
appliances including dishwashers and<br />
washing machines account for the other<br />
nine per cent. Taking a shower rather than a<br />
bath – in other words, using less hot <strong>water</strong><br />
– will therefore only have a relatively small<br />
effect on the carbon emissions from <strong>water</strong><br />
supply but a much bigger effect on carbon<br />
emissions from the home.<br />
Figure 3.2 Carbon emissions resulting from <strong>water</strong> supply, use and waste<strong>water</strong> treatment<br />
Carbon emissions from<br />
domestic <strong>water</strong> supply<br />
and waste<strong>water</strong> treatment<br />
Water supply 0.4%<br />
Water abstraction 1/6%<br />
Water treatment 2%<br />
Waste<strong>water</strong> treatment 7%<br />
Water in the home 89%<br />
Carbon emissions from<br />
<strong>water</strong> use in the home<br />
WC 7%<br />
Basin 11%<br />
Bath 14%<br />
Kitchen sink 21%<br />
Shower 12%<br />
Washing machine 16%<br />
Dishwasher 19%<br />
Sources: Environment Agency 51 (left chart) Energy Saving Trust (centre chart)<br />
Carbon emissions from<br />
all energy use in the home<br />
Other appliances 9%<br />
Cooking 3%<br />
Water-using appliances 9%<br />
Hot <strong>water</strong> 18%<br />
Lighting 5%<br />
Space heating and cooling 54%