

August 2005 - Library
August 2005 - Library
August 2005 - Library

Create successful ePaper yourself
Turn your PDF publications into a flip-book with our unique Google optimized e-Paper software.
o Improved Understanding of problems, others roles and other functions<br />
o Improved Communication by Reducing Story Telling<br />
o Reactive to Proactive transition<br />
Becoming Proactive<br />
While RCA is viewed by many as primarily a reactive tool, it becomes a proactive tool when applied pro p e r l y. For example, consider<br />
a premature gearbox failure due to poor lubricant because no oil analysis was in place to monitor oil quality. Subsequently, foreign<br />
particles contaminated the oil and resulted in premature wear. If it is further discovered that there was no oil analysis program to<br />
detect contamination, one of the corrective actions from this RCA should be to implement an oil analysis program for all critical<br />
equipment at the site. In this situation, many other pieces of equipment will be proactively addressed as a result of the findings<br />
from just one RCA.<br />
Close<br />
The key to an effective RCA is to assure that: 1) The problem is defined, 2) The analysis breaks down a problem into its individual<br />
causes, both actions and conditions, and documents them on a cause and effect chart, and 3) Solutions attack and eliminate the<br />
causes. The key is for people to think about the causes and resist the temptation to blindly accept that “stuff happens”.<br />
Once the RCA method is understood within an organization, the RCA program will serve as the foundation to support the RCA pro c e s s .<br />
Defining the RCA program goals, roles and responsibilities, training strategy, threshold criteria, action tracking system and<br />
effectiveness metrics will be the first step towards assuring the success of the program.<br />
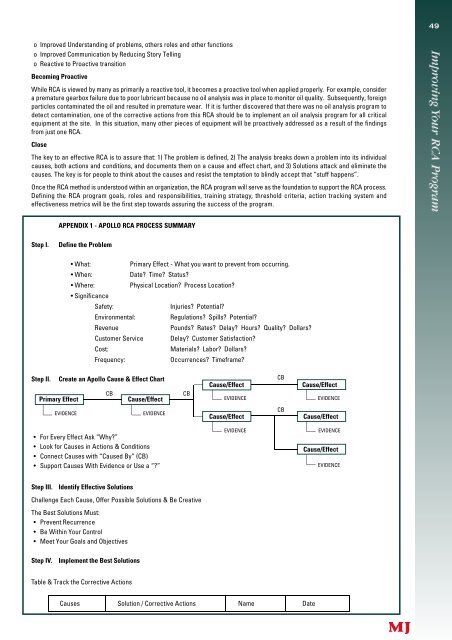
APPENDIX 1 - APOLLO RCA PROCESS SUMMARY<br />
Step I. Define the Problem<br />
• What: Primary Effect - What you want to prevent from occurring.<br />
• When: Date? Time? Status?<br />
• Where: Physical Location? Process Location?<br />
• Significance<br />
Safety: Injuries? Potential?<br />
Environmental: Regulations? Spills? Potential?<br />
Revenue Pounds? Rates? Delay? Hours? Quality? Dollars?<br />
Customer Service Delay? Customer Satisfaction?<br />
Cost: Materials? Labor? Dollars?<br />
Frequency: Occurrences? Timeframe?<br />
Step II. Create an Apollo Cause & Effect Chart<br />
Primary Effect<br />
EVIDENCE<br />
• For Every Effect Ask “Why?”<br />
• Look for Causes in Actions & Conditions<br />
• Connect Causes with “Caused By” (CB)<br />
• Support Causes With Evidence or Use a “?”<br />
Step III. Identify Effective Solutions<br />
Challenge Each Cause, Offer Possible Solutions & Be Creative<br />
The Best Solutions Must:<br />
• Prevent Recurrence<br />
• Be Within Your Control<br />
• Meet Your Goals and Objectives<br />
Step IV. Implement the Best Solutions<br />
Table & Track the Corrective Actions<br />
CB CB<br />
Cause/Effect<br />
EVIDENCE<br />
CB<br />
Cause/Effect Cause/Effect<br />
EVIDENCE EVIDENCE<br />
CB<br />
Cause/Effect Cause/Effect<br />
EVIDENCE EVIDENCE<br />
Causes Solution / Corrective Actions Name Date<br />
Cause/Effect<br />
EVIDENCE<br />
49


