

August 2005 - Library
August 2005 - Library
August 2005 - Library

You also want an ePaper? Increase the reach of your titles
YUMPU automatically turns print PDFs into web optimized ePapers that Google loves.
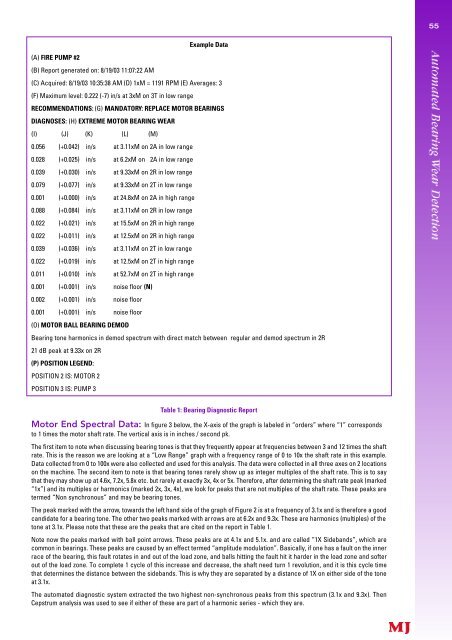
(A) FIRE PUMP #2<br />
(B) Report generated on: 8/19/03 11:07:22 AM<br />
Example Data<br />
(C) Acquired: 8/19/03 10:35:38 AM (D) 1xM = 1191 RPM (E) Averages: 3<br />
(F) Maximum level: 0.222 (-7) in/s at 3xM on 3T in low range<br />
RECOMMENDATIONS: (G) MANDATORY: REPLACE MOTOR BEARINGS<br />
DIAGNOSES: (H) EXTREME MOTOR BEARING WEAR<br />
(I) (J) (K) (L) (M)<br />
0.056 (+0.042) in/s at 3.11xM on 2A in low range<br />
0.028 (+0.025) in/s at 6.2xM on 2A in low range<br />
0.039 (+0.030) in/s at 9.33xM on 2R in low range<br />
0.079 (+0.077) in/s at 9.33xM on 2T in low range<br />
0.001 (+0.000) in/s at 24.8xM on 2A in high range<br />
0.088 (+0.084) in/s at 3.11xM on 2R in low range<br />
0.022 (+0.021) in/s at 15.5xM on 2R in high range<br />
0.022 (+0.011) in/s at 12.5xM on 2R in high range<br />
0.039 (+0.036) in/s at 3.11xM on 2T in low range<br />
0.022 (+0.019) in/s at 12.5xM on 2T in high range<br />
0.011 (+0.010) in/s at 52.7xM on 2T in high range<br />
0.001 (+0.001) in/s noise floor (N)<br />
0.002 (+0.001) in/s noise floor<br />
0.001 (+0.001) in/s noise floor<br />
(O) MOTOR BALL BEARING DEMOD<br />
Bearing tone harmonics in demod spectrum with direct match between regular and demod spectrum in 2R<br />
21 dB peak at 9.33x on 2R<br />
(P) POSITION LEGEND:<br />
POSITION 2 IS: MOTOR 2<br />
POSITION 3 IS: PUMP 3<br />
Table 1: Bearing Diagnostic Report<br />
Motor End Spectral Data: In figure 3 below, the X-axis of the graph is labeled in “orders” where “1” corresponds<br />
to 1 times the motor shaft rate. The vertical axis is in inches / second pk.<br />
The first item to note when discussing bearing tones is that they frequently appear at frequencies between 3 and 12 times the shaft<br />
rate. This is the reason we are looking at a “Low Range” graph with a frequency range of 0 to 10x the shaft rate in this example.<br />
Data collected from 0 to 100x were also collected and used for this analysis. The data were collected in all three axes on 2 locations<br />
on the machine. The second item to note is that bearing tones rarely show up as integer multiples of the shaft rate. This is to say<br />
that they may show up at 4.6x, 7.2x, 5.8x etc. but rarely at exactly 3x, 4x or 5x. There f o re, after determining the shaft rate peak (marked<br />
“1x”) and its multiples or harmonics (marked 2x, 3x, 4x), we look for peaks that are not multiples of the shaft rate. These peaks are<br />
termed “Non synchronous” and may be bearing tones.<br />
The peak marked with the arro w, towards the left hand side of the graph of Figure 2 is at a frequency of 3.1x and is there f o re a good<br />
candidate for a bearing tone. The other two peaks marked with arrows are at 6.2x and 9.3x. These are harmonics (multiples) of the<br />
tone at 3.1x. Please note that these are the peaks that are cited on the report in Table 1.<br />
Note now the peaks marked with ball point arrows. These peaks are at 4.1x and 5.1x. and are called “1X Sidebands”, which are<br />
common in bearings. These peaks are caused by an effect termed “amplitude modulation”. Basically, if one has a fault on the inner<br />
race of the bearing, this fault rotates in and out of the load zone, and balls hitting the fault hit it harder in the load zone and softer<br />
out of the load zone. To complete 1 cycle of this increase and decrease, the shaft need turn 1 revolution, and it is this cycle time<br />
that determines the distance between the sidebands. This is why they are separated by a distance of 1X on either side of the tone<br />
at 3.1x.<br />
The automated diagnostic system extracted the two highest non-synchronous peaks from this spectrum (3.1x and 9.3x). Then<br />
Cepstrum analysis was used to see if either of these are part of a harmonic series - which they are.<br />
55


