SCEBs - University of Colorado Boulder
SCEBs - University of Colorado Boulder
SCEBs - University of Colorado Boulder

You also want an ePaper? Increase the reach of your titles
YUMPU automatically turns print PDFs into web optimized ePapers that Google loves.
expected deflections or the unit‟s deformability. The average dry density (ambient<br />
conditions), UCS, MOR, and Young‟s Modulus values for all the tests performed are<br />
reported in Appendix 8.3.2.<br />
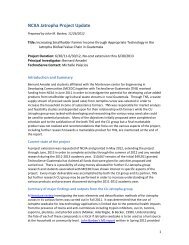
Stress [psi]<br />
4.2.3. Results<br />
UMU Sample #11: Example Stress vs Strain Curve<br />
1200<br />
1000<br />
800<br />
600<br />
400<br />
200<br />
0<br />
E = 43.8 ksi<br />
0.0% 1.0% 2.0% 3.0% 4.0% 5.0%<br />
Strain<br />
Figure 4.17: Example Stress vs. Strain Curve<br />
4.2.3.1. Durability Results<br />
The procedure outlined in Section 3.10 was followed to determine the durability<br />
characteristics <strong>of</strong> the mini-blocks produced. To summarize, mini-block specimens were<br />
submerged in water for 24 hours and then tested in compression. The remaining<br />
specimens were allowed to dry for a minimum <strong>of</strong> 48 hours before being submerged<br />
again. The expected decrease in the UCS values with the number <strong>of</strong> saturation cycles is<br />
clearly observed over the series <strong>of</strong> six saturation cycles performed for both soil Samples<br />
#11 & #15. However, the rate at which the UCS decreases also appears to decrease as<br />
the number <strong>of</strong> saturation cycles increases. In other words, the trends illustrated in<br />
Figures 4.18 & 4.19 suggest that the UCS values may be approaching a minimum value<br />
asymptotically. The mini-blocks remained almost entirely intact while their UCS values<br />
50