SCEBs - University of Colorado Boulder
SCEBs - University of Colorado Boulder
SCEBs - University of Colorado Boulder

Create successful ePaper yourself
Turn your PDF publications into a flip-book with our unique Google optimized e-Paper software.
Average UCS [psi]<br />
Average UCS [psi]<br />
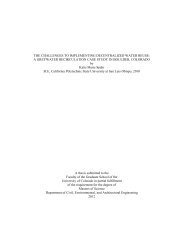
UMU 1:3 Soil Mix: Average UCS vs Average MOR<br />
1400<br />
1300<br />
1200<br />
1100<br />
y = 4.0486x + 622.05<br />
R 2 = 0.8472<br />
1000<br />
50 100 150 200<br />
800<br />
700<br />
600<br />
500<br />
400<br />
Average MOR [psi]<br />
Data Points<br />
Trend-Line<br />
Figure 5.5: UMU 1:3 Soil Mix; UCS/MOR Correlation<br />
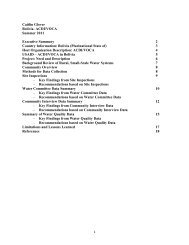
UMU 1:1 Soil Mix: Average UCS vs Average MOR<br />
y = 3.3695x + 419.78<br />
R 2 = 0.8744<br />
Data Points<br />
Trend-Line<br />
40 60 80 100<br />
Average MOR [psi]<br />
Figure 5.6: UMU 1:1 Soil Mix; UCS/MOR Correlation<br />
A strong correlation between UCS and MOR implies that the results from the<br />
relatively inexpensive three-point bending test can be used to infer compressive strength<br />
characteristics, which are more costly to determine. The analyses results shown in<br />
Figures 5.5 & 5.6 suggest that the relationship between SCEB UCS and MOR values can<br />
be correlated. Linear regression analyses resulted in relatively high R 2 values (goodness<br />
<strong>of</strong> fit measure) <strong>of</strong> 0.85 and 0.87 for the two soil mixes tested. Additional testing <strong>of</strong> this<br />
60