- Page 1 and 2:
Recommended Budget and ResouRce all
- Page 3 and 4:
FY 2011/2012 Recommended Budget and
- Page 5 and 6:
Honorable Mayor and Members of the
- Page 7 and 8:
Current Financial Condition Citywid
- Page 9 and 10:
General Fund As Figure 3 indicates,
- Page 11 and 12:
of $97.8 million will be required i
- Page 13 and 14:
last fiscal year. Projections for F
- Page 15 and 16:
Safety Managers Association (PSMA),
- Page 17 and 18:
contributions required of public ag
- Page 19 and 20:
that time, a portion of the ongoing
- Page 21 and 22:
Public Safety until this transition
- Page 23 and 24:
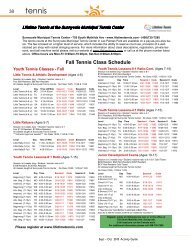
Moving forward, golf and tennis ope
- Page 25 and 26:
C i t y M a n a g e r ' s M e s s a
- Page 27 and 28:
C i t y M a n a g e r ' s M e s s a
- Page 29 and 30:
Mathilda Avenue Bridge over Caltrai
- Page 31 and 32:
C i t y M a n a g e r ' s M e s s a
- Page 33 and 34:
Addressing the Long Term Structural
- Page 35 and 36:
Budget Summary
- Page 37 and 38:
EXPENDITURES: Operating Budget: CIT
- Page 39 and 40:
Projects Budget: CITY OF SUNNYVALE
- Page 41 and 42:
Revenues: CITY OF SUNNYVALE CALCULA
- Page 43 and 44:
This Page Not Used
- Page 45 and 46:
GENERAL FUND The General Fund is us
- Page 47 and 48:
Recommended Revenues - General Fund
- Page 49 and 50:
the other fi ve cases, the actual C
- Page 51 and 52:
City of Sunnyvale Sales Tax Receipt
- Page 53 and 54:
Franchise Fee revenue. The PG&E fra
- Page 55 and 56:
which were slightly higher in the f
- Page 57 and 58:
category of projects represents the
- Page 59 and 60:
years and increases throughout the
- Page 61 and 62:
CITY OF SUNNYVALE 035. GENERAL FUND
- Page 63 and 64:
CITY OF SUNNYVALE 035. GENERAL FUND
- Page 65 and 66:
0150 Secured Tax 0152 Unitary Roll
- Page 67 and 68:
0454-04 Utility User's Tax - Other
- Page 69 and 70:
0751-14 Rental - Raynor Child Care
- Page 71 and 72:
0965-01 Homeland Security Grants 10
- Page 73 and 74:
1351-01 Major Permit Application Fe
- Page 75 and 76:
1504 Fines - Traffic and Criminal 1
- Page 77 and 78:
2102 Library- Lost/Damaged Material
- Page 79 and 80:
2770 DPS Alarm Permit Fees 2772-01
- Page 81 and 82:
TOTAL REPAYMENT TO CITY - TOWN CENT
- Page 83 and 84:
TOTAL SALE OF PROPERTY 4400 Transfe
- Page 85 and 86:
Financial Plans - Special Revenue F
- Page 87 and 88:
the form of a loan, with payments e
- Page 89 and 90:
Rental Assistance ($143,442), and M
- Page 91 and 92:
moved to raise the standard to 3.0
- Page 93 and 94:
program. At that time, the Public S
- Page 95 and 96:
only for its most stable funding re
- Page 97 and 98:
Relief Fund (Proposition 42) have b
- Page 99 and 100:
▪ Redevelopment Agency Fund The S
- Page 101 and 102:
to expected valuation appeals. Tax
- Page 103 and 104:
This Page Not Used
- Page 105 and 106:
RESERVE/FUND BALANCE, JULY 1 CURREN
- Page 107 and 108:
RESERVE/FUND BALANCE, JULY 1 CURREN
- Page 109 and 110:
RESERVE/FUND BALANCE, JULY 1 CURREN
- Page 111 and 112:
RESERVE/FUND BALANCE, JULY 1 CURREN
- Page 113 and 114:
RESERVE/FUND BALANCE, JULY 1 CURREN
- Page 115 and 116:
RESERVE/FUND BALANCE, JULY 1 CURREN
- Page 117 and 118:
This Page Not Used
- Page 119 and 120:
This Page Not Used
- Page 121 and 122:
RESERVE/FUND BALANCE, JULY 1 CURREN
- Page 123 and 124:
RESERVE/FUND BALANCE, JULY 1 CURREN
- Page 125 and 126:
RESERVE/FUND BALANCE, JULY 1 CURREN
- Page 127 and 128:
This Page Not Used
- Page 129 and 130:
RESERVE/FUND BALANCE, JULY 1 CURREN
- Page 131 and 132:
RESERVE/FUND BALANCE, JULY 1 CURREN
- Page 133 and 134:
CAPITAL AND INFRASTRUCTURE PROJECTS
- Page 135 and 136:
oadway capacity improvement project
- Page 137 and 138:
Infrastructure ($2.5 million), Play
- Page 139 and 140:
RESERVE/FUND BALANCE, JULY 1 CURREN
- Page 141 and 142:
RESERVE/FUND BALANCE, JULY 1 CURREN
- Page 143 and 144:
RESERVE/FUND BALANCE, JULY 1 CURREN
- Page 145 and 146:
RESERVE/FUND BALANCE, JULY 1 CURREN
- Page 147 and 148:
RESERVE/FUND BALANCE, JULY 1 CURREN
- Page 149 and 150:
RESERVE/FUND BALANCE, JULY 1 CURREN
- Page 151 and 152:
RESERVE/FUND BALANCE, JULY 1 CURREN
- Page 153 and 154:
RESERVE/FUND BALANCE, JULY 1 CURREN
- Page 155 and 156:
RESERVE/FUND BALANCE, JULY 1 CURREN
- Page 157 and 158:
RESERVE/FUND BALANCE, JULY 1 CURREN
- Page 159 and 160:
Financial Plans - Enterprise Funds
- Page 161 and 162:
for utility rates as required by Pr
- Page 163 and 164:
epresents a 45% increase in the cos
- Page 165 and 166:
Finally, the City’s Water Polluti
- Page 167 and 168:
utility: Distribution of Costs to F
- Page 169 and 170:
FY 2011/2012 is 18%, twice what was
- Page 171 and 172:
for 20 years. Payment of the loan b
- Page 173 and 174:
actual expenditures from the last f
- Page 175 and 176:
capital project to replace the SMaR
- Page 177 and 178:
through the generation of additiona
- Page 179 and 180:
RESERVE/FUND BALANCE, JULY 1 CURREN
- Page 181 and 182:
This Page Not Used
- Page 183 and 184:
RESERVE/FUND BALANCE, JULY 1 CURREN
- Page 185 and 186:
This Page Not Used
- Page 187 and 188:
RESERVE/FUND BALANCE, JULY 1 CURREN
- Page 189 and 190:
This Page Not Used
- Page 191 and 192:
RESERVE/FUND BALANCE, JULY 1 CURREN
- Page 193 and 194:
RESERVE/FUND BALANCE, JULY 1 CURREN
- Page 195 and 196:
RESERVE/FUND BALANCE, JULY 1 CURREN
- Page 197 and 198:
CITY OF SUNNYVALE 525/200. RECREATI
- Page 199 and 200:
2309 Mobile Recreation Fee Based 23
- Page 201 and 202:
2455 SMS After-school Programs 2465
- Page 203 and 204: 4400-36 Transfer From Dorolou Swirs
- Page 205 and 206: INTERNAL SERVICE FUNDS The City uti
- Page 207 and 208: The Equipment Replacement line item
- Page 209 and 210: communications, and satellite copie
- Page 211 and 212: annually over the entire planning p
- Page 213 and 214: salaries (PERSable earnings) in ord
- Page 215 and 216: satisfy the City’s fi nancial rep
- Page 217 and 218: donation, the City established the
- Page 219 and 220: RESERVES/FUND BALANCE, JULY 1 CURRE
- Page 221 and 222: RESERVES/FUND BALANCE, JULY 1 CURRE
- Page 223 and 224: RESERVES/FUND BALANCE, JULY 1 CURRE
- Page 225 and 226: RESERVES/FUND BALANCE, JULY 1 CURRE
- Page 227 and 228: RESERVES/FUND BALANCE, JULY 1 CURRE
- Page 229 and 230: CITY OF SUNNYVALE 595/800. GENERAL
- Page 231 and 232: RESERVE/FUND BALANCE, JULY 1 CURREN
- Page 233 and 234: RESERVE/FUND BALANCE, JULY 1 CURREN
- Page 235 and 236: RESERVE/FUND BALANCE, JULY 1 CURREN
- Page 237 and 238: RESERVE/FUND BALANCE, JULY 1 CURREN
- Page 239 and 240: RESERVE/FUND BALANCE, JULY 1 CURREN
- Page 241 and 242: RESERVE/FUND BALANCE, JULY 1 CURREN
- Page 243 and 244: RESERVE/FUND BALANCE, JULY 1 CURREN
- Page 245 and 246: RESERVE/FUND BALANCE, JULY 1 CURREN
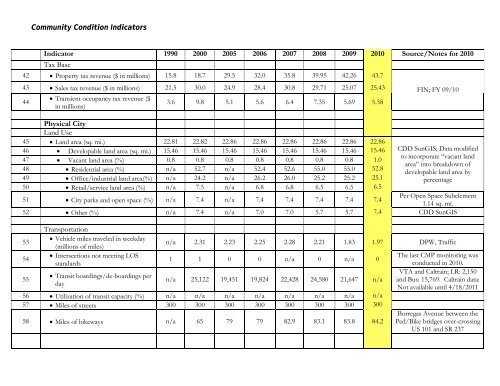
- Page 247 and 248: Community Condition Indicators
- Page 249 and 250: HOW TO USE THE CITY OF SUNNYVALE’
- Page 251 and 252: Community Condition Indicators Indi
- Page 253: Community Condition Indicators Indi
- Page 257: This Page Not Used