20-Year Resource Allocation Plan - City of Sunnyvale
20-Year Resource Allocation Plan - City of Sunnyvale
20-Year Resource Allocation Plan - City of Sunnyvale

Create successful ePaper yourself
Turn your PDF publications into a flip-book with our unique Google optimized e-Paper software.
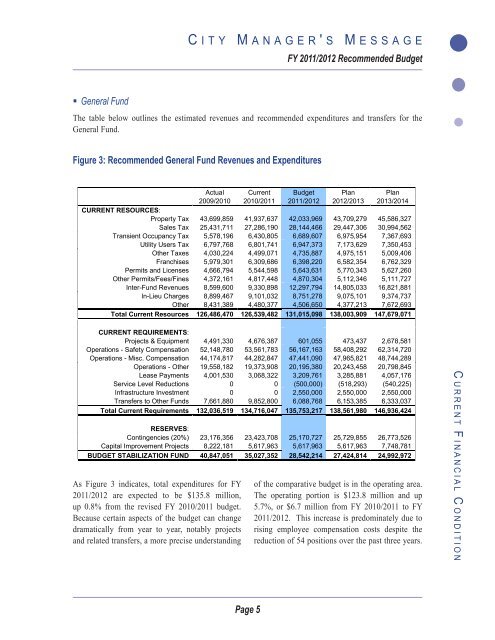
General Fund<br />
As Figure 3 indicates, total expenditures for FY<br />
<strong>20</strong>11/<strong>20</strong>12 are expected to be $135.8 million,<br />
up 0.8% from the revised FY <strong>20</strong>10/<strong>20</strong>11 budget.<br />
Because certain aspects <strong>of</strong> the budget can change<br />
dramatically from year to year, notably projects<br />
and related transfers, a more precise understanding<br />
C i t y M a n a g e r ' s M e s s a g e<br />
Page 5<br />
FY <strong>20</strong>11/<strong>20</strong>12 Recommended Budget<br />
The table below outlines the estimated revenues and recommended expenditures and transfers for the<br />
General Fund.<br />
Figure 3: Recommended General Fund Revenues and Expenditures<br />
Actual Current Budget <strong>Plan</strong> <strong>Plan</strong><br />
<strong>20</strong>09/<strong>20</strong>10 <strong>20</strong>10/<strong>20</strong>11 <strong>20</strong>11/<strong>20</strong>12 <strong>20</strong>12/<strong>20</strong>13 <strong>20</strong>13/<strong>20</strong>14<br />
CURRENT RESOURCES:<br />
Property Tax 43,699,859 41,937,637 42,033,969 43,709,279 45,586,327<br />
Sales Tax 25,431,711 27,286,190 28,144,466 29,447,306 30,994,562<br />
Transient Occupancy Tax 5,578,196 6,430,805 6,689,607 6,975,954 7,367,693<br />
Utility Users Tax 6,797,768 6,801,741 6,947,373 7,173,629 7,350,453<br />
Other Taxes 4,030,224 4,499,071 4,735,887 4,975,151 5,009,406<br />
Franchises 5,979,301 6,309,686 6,398,2<strong>20</strong> 6,582,354 6,762,329<br />
Permits and Licenses 4,666,794 5,544,598 5,643,631 5,770,343 5,627,260<br />
Other Permits/Fees/Fines 4,372,161 4,817,448 4,870,304 5,112,346 5,111,727<br />
Inter-Fund Revenues 8,599,600 9,330,898 12,297,794 14,805,033 16,821,881<br />
In-Lieu Charges 8,899,467 9,101,032 8,751,278 9,075,101 9,374,737<br />
Other 8,431,389 4,480,377 4,506,650 4,377,213 7,672,693<br />
Total Current <strong>Resource</strong>s 126,486,470 126,539,482 131,015,098 138,003,909 147,679,071<br />
CURRENT REQUIREMENTS:<br />
Projects & Equipment 4,491,330 4,676,387 601,055 473,437 2,678,581<br />
Operations - Safety Compensation 52,148,780 53,561,783 56,167,163 58,408,292 62,314,7<strong>20</strong><br />
Operations - Misc. Compensation 44,174,817 44,282,847 47,441,090 47,965,821 48,744,289<br />
Operations - Other 19,558,182 19,373,908 <strong>20</strong>,195,380 <strong>20</strong>,243,458 <strong>20</strong>,798,845<br />
Lease Payments 4,001,530 3,068,322 3,<strong>20</strong>9,761 3,285,881 4,057,176<br />
Service Level Reductions 0 0 (500,000) (518,293) (540,225)<br />
Infrastructure Investment 0 0 2,550,000 2,550,000 2,550,000<br />
Transfers to Other Funds 7,661,880 9,852,800 6,088,768 6,153,385 6,333,037<br />
Total Current Requirements 132,036,519 134,716,047 135,753,217 138,561,980 146,936,424<br />
RESERVES:<br />
Contingencies (<strong>20</strong>%) 23,176,356 23,423,708 25,170,727 25,729,855 26,773,526<br />
Capital Improvement Projects 8,222,181 5,617,963 5,617,963 5,617,963 7,748,781<br />
BUDGET STABILIZATION FUND 40,847,051 35,027,352 28,542,214 27,424,814 24,992,972<br />
<strong>of</strong> the comparative budget is in the operating area.<br />
The operating portion is $123.8 million and up<br />
5.7%, or $6.7 million from FY <strong>20</strong>10/<strong>20</strong>11 to FY<br />
<strong>20</strong>11/<strong>20</strong>12. This increase is predominately due to<br />
rising employee compensation costs despite the<br />
reduction <strong>of</strong> 54 positions over the past three years.<br />
C U R R E N T F I N A N C I A L C O N D I T I O N