

Download Complete Issue in PDF - Educational Technology & Society
Download Complete Issue in PDF - Educational Technology & Society
Download Complete Issue in PDF - Educational Technology & Society

You also want an ePaper? Increase the reach of your titles
YUMPU automatically turns print PDFs into web optimized ePapers that Google loves.
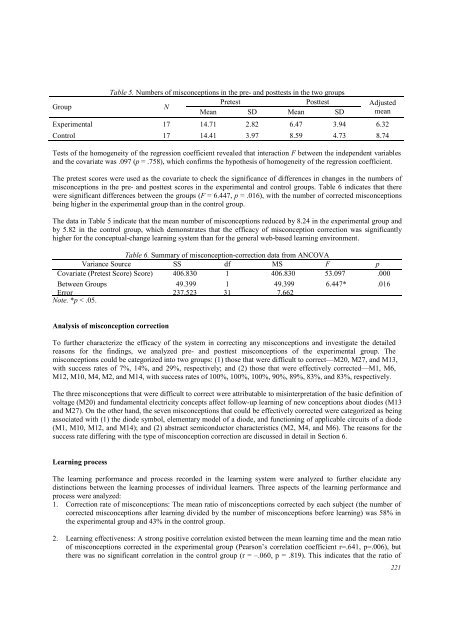
Table 5. Numbers of misconceptions <strong>in</strong> the pre- and posttests <strong>in</strong> the two groups<br />
Group N<br />
Pretest<br />
Mean SD<br />
Posttest<br />
Mean SD<br />
Adjusted<br />
mean<br />
Experimental 17 14.71 2.82 6.47 3.94 6.32<br />
Control 17 14.41 3.97 8.59 4.73 8.74<br />
Tests of the homogeneity of the regression coefficient revealed that <strong>in</strong>teraction F between the <strong>in</strong>dependent variables<br />
and the covariate was .097 (p = .758), which confirms the hypothesis of homogeneity of the regression coefficient.<br />
The pretest scores were used as the covariate to check the significance of differences <strong>in</strong> changes <strong>in</strong> the numbers of<br />
misconceptions <strong>in</strong> the pre- and posttest scores <strong>in</strong> the experimental and control groups. Table 6 <strong>in</strong>dicates that there<br />
were significant differences between the groups (F = 6.447, p = .016), with the number of corrected misconceptions<br />
be<strong>in</strong>g higher <strong>in</strong> the experimental group than <strong>in</strong> the control group.<br />
The data <strong>in</strong> Table 5 <strong>in</strong>dicate that the mean number of misconceptions reduced by 8.24 <strong>in</strong> the experimental group and<br />
by 5.82 <strong>in</strong> the control group, which demonstrates that the efficacy of misconception correction was significantly<br />
higher for the conceptual-change learn<strong>in</strong>g system than for the general web-based learn<strong>in</strong>g environment.<br />
Table 6. Summary of misconception-correction data from ANCOVA<br />
Variance Source SS df MS F p<br />
Covariate (Pretest Score) Score) 406.830 1 406.830 53.097 .000<br />
Between Groups 49.399 1 49.399 6.447* .016<br />
Error 237.523 31 7.662<br />
Note. *p < .05.<br />
Analysis of misconception correction<br />
To further characterize the efficacy of the system <strong>in</strong> correct<strong>in</strong>g any misconceptions and <strong>in</strong>vestigate the detailed<br />
reasons for the f<strong>in</strong>d<strong>in</strong>gs, we analyzed pre- and posttest misconceptions of the experimental group. The<br />
misconceptions could be categorized <strong>in</strong>to two groups: (1) those that were difficult to correct—M20, M27, and M13,<br />
with success rates of 7%, 14%, and 29%, respectively; and (2) those that were effectively corrected—M1, M6,<br />
M12, M10, M4, M2, and M14, with success rates of 100%, 100%, 100%, 90%, 89%, 83%, and 83%, respectively.<br />
The three misconceptions that were difficult to correct were attributable to mis<strong>in</strong>terpretation of the basic def<strong>in</strong>ition of<br />
voltage (M20) and fundamental electricity concepts affect follow-up learn<strong>in</strong>g of new conceptions about diodes (M13<br />
and M27). On the other hand, the seven misconceptions that could be effectively corrected were categorized as be<strong>in</strong>g<br />
associated with (1) the diode symbol, elementary model of a diode, and function<strong>in</strong>g of applicable circuits of a diode<br />
(M1, M10, M12, and M14); and (2) abstract semiconductor characteristics (M2, M4, and M6). The reasons for the<br />
success rate differ<strong>in</strong>g with the type of misconception correction are discussed <strong>in</strong> detail <strong>in</strong> Section 6.<br />
Learn<strong>in</strong>g process<br />
The learn<strong>in</strong>g performance and process recorded <strong>in</strong> the learn<strong>in</strong>g system were analyzed to further elucidate any<br />
dist<strong>in</strong>ctions between the learn<strong>in</strong>g processes of <strong>in</strong>dividual learners. Three aspects of the learn<strong>in</strong>g performance and<br />
process were analyzed:<br />
1. Correction rate of misconceptions: The mean ratio of misconceptions corrected by each subject (the number of<br />
corrected misconceptions after learn<strong>in</strong>g divided by the number of misconceptions before learn<strong>in</strong>g) was 58% <strong>in</strong><br />
the experimental group and 43% <strong>in</strong> the control group.<br />
2. Learn<strong>in</strong>g effectiveness: A strong positive correlation existed between the mean learn<strong>in</strong>g time and the mean ratio<br />
of misconceptions corrected <strong>in</strong> the experimental group (Pearson’s correlation coefficient r=.641, p=.006), but<br />
there was no significant correlation <strong>in</strong> the control group (r = –.060, p = .819). This <strong>in</strong>dicates that the ratio of<br />
221


