

Download Complete Issue in PDF - Educational Technology & Society
Download Complete Issue in PDF - Educational Technology & Society
Download Complete Issue in PDF - Educational Technology & Society

You also want an ePaper? Increase the reach of your titles
YUMPU automatically turns print PDFs into web optimized ePapers that Google loves.
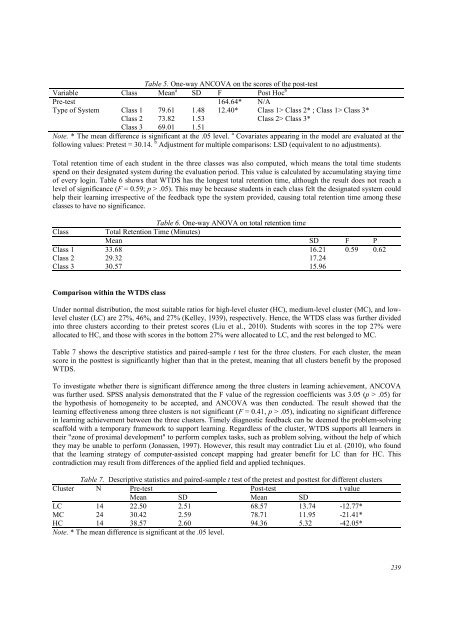
Table 5. One-way ANCOVA on the scores of the post-test<br />
Variable Class Mean a SD F Post Hoc b<br />
Pre-test 164.64* N/A<br />
Type of System Class 1 79.61 1.48 12.40* Class 1> Class 2* ; Class 1> Class 3*<br />
Class 2 73.82 1.53 Class 2> Class 3*<br />
Class 3 69.01 1.51<br />
Note. * The mean difference is significant at the .05 level. a Covariates appear<strong>in</strong>g <strong>in</strong> the model are evaluated at the<br />
follow<strong>in</strong>g values: Pretest = 30.14. b Adjustment for multiple comparisons: LSD (equivalent to no adjustments).<br />
Total retention time of each student <strong>in</strong> the three classes was also computed, which means the total time students<br />
spend on their designated system dur<strong>in</strong>g the evaluation period. This value is calculated by accumulat<strong>in</strong>g stay<strong>in</strong>g time<br />
of every log<strong>in</strong>. Table 6 shows that WTDS has the longest total retention time, although the result does not reach a<br />
level of significance (F = 0.59; p > .05). This may be because students <strong>in</strong> each class felt the designated system could<br />
help their learn<strong>in</strong>g irrespective of the feedback type the system provided, caus<strong>in</strong>g total retention time among these<br />
classes to have no significance.<br />
Table 6. One-way ANOVA on total retention time<br />
Class Total Retention Time (M<strong>in</strong>utes)<br />
Mean SD F P<br />
Class 1 33.68 16.21 0.59 0.62<br />
Class 2 29.32 17.24<br />
Class 3 30.57 15.96<br />
Comparison with<strong>in</strong> the WTDS class<br />
Under normal distribution, the most suitable ratios for high-level cluster (HC), medium-level cluster (MC), and lowlevel<br />
cluster (LC) are 27%, 46%, and 27% (Kelley, 1939), respectively. Hence, the WTDS class was further divided<br />
<strong>in</strong>to three clusters accord<strong>in</strong>g to their pretest scores (Liu et al., 2010). Students with scores <strong>in</strong> the top 27% were<br />
allocated to HC, and those with scores <strong>in</strong> the bottom 27% were allocated to LC, and the rest belonged to MC.<br />
Table 7 shows the descriptive statistics and paired-sample t test for the three clusters. For each cluster, the mean<br />
score <strong>in</strong> the posttest is significantly higher than that <strong>in</strong> the pretest, mean<strong>in</strong>g that all clusters benefit by the proposed<br />
WTDS.<br />
To <strong>in</strong>vestigate whether there is significant difference among the three clusters <strong>in</strong> learn<strong>in</strong>g achievement, ANCOVA<br />
was further used. SPSS analysis demonstrated that the F value of the regression coefficients was 3.05 (p > .05) for<br />
the hypothesis of homogeneity to be accepted, and ANCOVA was then conducted. The result showed that the<br />
learn<strong>in</strong>g effectiveness among three clusters is not significant (F = 0.41, p > .05), <strong>in</strong>dicat<strong>in</strong>g no significant difference<br />
<strong>in</strong> learn<strong>in</strong>g achievement between the three clusters. Timely diagnostic feedback can be deemed the problem-solv<strong>in</strong>g<br />
scaffold with a temporary framework to support learn<strong>in</strong>g. Regardless of the cluster, WTDS supports all learners <strong>in</strong><br />
their "zone of proximal development" to perform complex tasks, such as problem solv<strong>in</strong>g, without the help of which<br />
they may be unable to perform (Jonassen, 1997). However, this result may contradict Liu et al. (2010), who found<br />
that the learn<strong>in</strong>g strategy of computer-assisted concept mapp<strong>in</strong>g had greater benefit for LC than for HC. This<br />
contradiction may result from differences of the applied field and applied techniques.<br />
Table 7. Descriptive statistics and paired-sample t test of the pretest and posttest for different clusters<br />
Cluster N Pre-test Post-test t value<br />
Mean SD Mean SD<br />
LC 14 22.50 2.51 68.57 13.74 -12.77*<br />
MC 24 30.42 2.59 78.71 11.95 -21.41*<br />
HC 14 38.57 2.60 94.36 5.32 -42.05*<br />
Note. * The mean difference is significant at the .05 level.<br />
239


