Download - Educational Technology & Society
Download - Educational Technology & Society
Download - Educational Technology & Society
You also want an ePaper? Increase the reach of your titles
YUMPU automatically turns print PDFs into web optimized ePapers that Google loves.
all the students. At the midpoint of the course, the treatment for the students was changed. The first group continued<br />
in the class room and the second group on the web. Moreover, the same attitude survey, which carried out at UTU in<br />
2004, was administered in both of the aforementioned universities.<br />
The study concluded that it is good to introduce easy and guided exercises at the very beginning of the course. In<br />
addition to this, there is an emerging need for both web-based and classroom exercises. The recommended way to<br />
introduce the web-based exercises in DSA courses is by combining these two approaches. There is a set of exercises<br />
that are more suitable to be solved and automatically assessed on the web while the rest of the exercises are more<br />
suitable for traditional classroom sessions. More detailed information about this repetition study can be found<br />
in Laakso et al. (2005b).<br />
The above studies were whole semester studies, in which the focus was on students’ overall performance and dropout<br />
rates. The difference between the treatments were in learning settings: the control groups were in classroom<br />
while the treatment groups were on the web. However, the learning objectives were the same for all groups, i.e., the<br />
exercises were algorithm simulation exercises. In addition, we studied the students’ attitudes towards web based<br />
learning environments.<br />
In contrast to the above studies, Myller et al. (2007) conducted an experimental study focusing on engagement<br />
taxonomy in fall 2006 at University of Turku. In the study, the learning outcomes of the students, who learned in<br />
collaboration by using visualization on different engagement levels were compared. There were 52 students in the<br />
treatment group (EET level: changing) and 53 students in the control group (EET level: controlled viewing), which<br />
sums up to 105 participants. The setup was a pre-test, treatment, post-test design. The post-test included the same<br />
questions as the pre-test, and additionally more difficult questions in order to see if the differences were apparent in<br />
them. The results indicated that the level of engagement had an effect on students’ learning results in favor of the<br />
treatment group, although the differences were not statistically significant. Especially students without previous<br />
knowledge seemed to learn more from using visualizations on higher engagement level. In this paper, we report on a<br />
replication of this study with minor changes in order to repair the flaws in the design of the pre-test and post-test as<br />
reported by Myller et al. (2007).<br />
Experimental Setup<br />
To summarize the previous sections, the collaborative use of AV tools has been studied only little, yet the need for<br />
this kind of research emerges from the increasing use of visualization tools in collaborative learning. We hypothesize<br />
that the EET framework can be used to predict performance differences when visualizations are used in<br />
collaboration. Previous research supports this view and our hypothesis is based on the previous research on<br />
TRAKLA2 and formulated as follows: Students using visualizations collaboratively on EET-level changing (i.e. in<br />
pairs) perform better compared to students using only visualization on EET-level controlled viewing (again in pairs).<br />
In order to test our hypothesis, we carried out an experiment in which we compared the learning outcomes of<br />
students who were collaboratively using visualizations which were on different EET levels. Participants were<br />
(mostly first year) Computer Science major students on a data structures and algorithms course at the Helsinki<br />
University of <strong>Technology</strong>. We utilized TRAKLA2 (Korhonen et al., 2004) in order to provide students with<br />
algorithm simulation exercises that act on the EET level changing (treatment group). However, the students did not<br />
have the option to reset the exercise to obtain a new similar exercise with new input data, but they had to work with a<br />
fixed input data for each exercise during the whole session. The animations that the students used in controlled<br />
viewing condition (control group) were similar to those used in model answers provided by the TRAKLA2 system.<br />
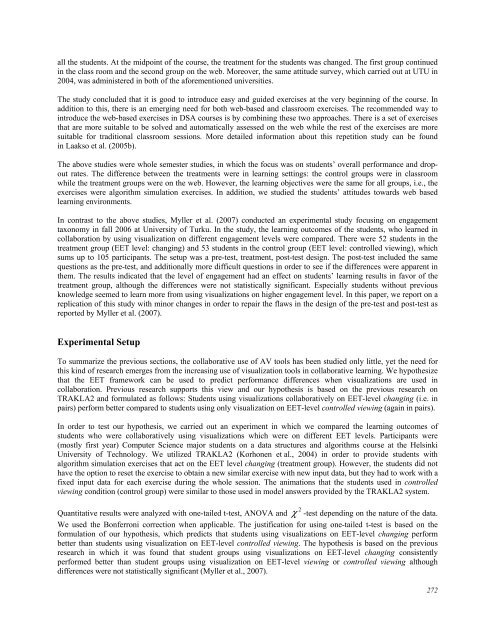
Quantitative results were analyzed with one-tailed t-test, ANOVA and<br />
2<br />
χ -test depending on the nature of the data.<br />
We used the Bonferroni correction when applicable. The justification for using one-tailed t-test is based on the<br />
formulation of our hypothesis, which predicts that students using visualizations on EET-level changing perform<br />
better than students using visualization on EET-level controlled viewing. The hypothesis is based on the previous<br />
research in which it was found that student groups using visualizations on EET-level changing consistently<br />
performed better than student groups using visualization on EET-level viewing or controlled viewing although<br />
differences were not statistically significant (Myller et al., 2007).<br />
272


