

Download - Educational Technology & Society
Download - Educational Technology & Society
Download - Educational Technology & Society

You also want an ePaper? Increase the reach of your titles
YUMPU automatically turns print PDFs into web optimized ePapers that Google loves.
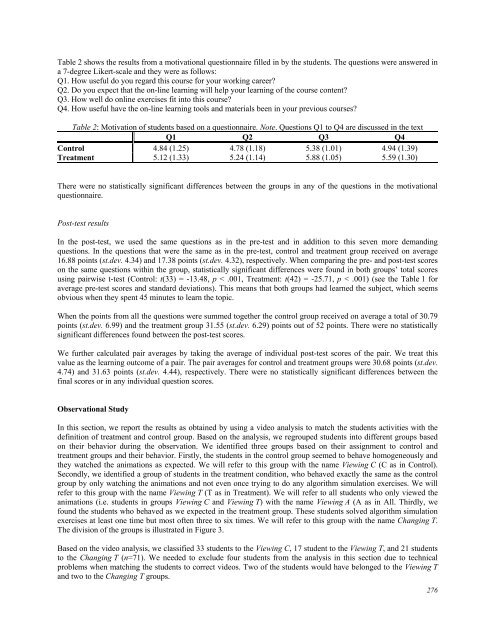
Table 2 shows the results from a motivational questionnaire filled in by the students. The questions were answered in<br />
a 7-degree Likert-scale and they were as follows:<br />
Q1. How useful do you regard this course for your working career?<br />
Q2. Do you expect that the on-line learning will help your learning of the course content?<br />
Q3. How well do online exercises fit into this course?<br />
Q4. How useful have the on-line learning tools and materials been in your previous courses?<br />
Table 2: Motivation of students based on a questionnaire. Note. Questions Q1 to Q4 are discussed in the text<br />
Q1 Q2 Q3 Q4<br />
Control 4.84 (1.25) 4.78 (1.18) 5.38 (1.01) 4.94 (1.39)<br />
Treatment 5.12 (1.33) 5.24 (1.14) 5.88 (1.05) 5.59 (1.30)<br />
There were no statistically significant differences between the groups in any of the questions in the motivational<br />
questionnaire.<br />
Post-test results<br />
In the post-test, we used the same questions as in the pre-test and in addition to this seven more demanding<br />
questions. In the questions that were the same as in the pre-test, control and treatment group received on average<br />
16.88 points (st.dev. 4.34) and 17.38 points (st.dev. 4.32), respectively. When comparing the pre- and post-test scores<br />
on the same questions within the group, statistically significant differences were found in both groups’ total scores<br />
using pairwise t-test (Control: t(33) = -13.48, p < .001, Treatment: t(42) = -25.71, p < .001) (see the Table 1 for<br />
average pre-test scores and standard deviations). This means that both groups had learned the subject, which seems<br />
obvious when they spent 45 minutes to learn the topic.<br />
When the points from all the questions were summed together the control group received on average a total of 30.79<br />
points (st.dev. 6.99) and the treatment group 31.55 (st.dev. 6.29) points out of 52 points. There were no statistically<br />
significant differences found between the post-test scores.<br />
We further calculated pair averages by taking the average of individual post-test scores of the pair. We treat this<br />
value as the learning outcome of a pair. The pair averages for control and treatment groups were 30.68 points (st.dev.<br />
4.74) and 31.63 points (st.dev. 4.44), respectively. There were no statistically significant differences between the<br />
final scores or in any individual question scores.<br />
Observational Study<br />
In this section, we report the results as obtained by using a video analysis to match the students activities with the<br />
definition of treatment and control group. Based on the analysis, we regrouped students into different groups based<br />
on their behavior during the observation. We identified three groups based on their assignment to control and<br />
treatment groups and their behavior. Firstly, the students in the control group seemed to behave homogeneously and<br />
they watched the animations as expected. We will refer to this group with the name Viewing C (C as in Control).<br />
Secondly, we identified a group of students in the treatment condition, who behaved exactly the same as the control<br />
group by only watching the animations and not even once trying to do any algorithm simulation exercises. We will<br />
refer to this group with the name Viewing T (T as in Treatment). We will refer to all students who only viewed the<br />
animations (i.e. students in groups Viewing C and Viewing T) with the name Viewing A (A as in All. Thirdly, we<br />
found the students who behaved as we expected in the treatment group. These students solved algorithm simulation<br />
exercises at least one time but most often three to six times. We will refer to this group with the name Changing T.<br />
The division of the groups is illustrated in Figure 3.<br />
Based on the video analysis, we classified 33 students to the Viewing C, 17 student to the Viewing T, and 21 students<br />
to the Changing T (n=71). We needed to exclude four students from the analysis in this section due to technical<br />
problems when matching the students to correct videos. Two of the students would have belonged to the Viewing T<br />
and two to the Changing T groups.<br />
276


