Profiling Nios II Systems Application Note 391 - Altera
Profiling Nios II Systems Application Note 391 - Altera
Profiling Nios II Systems Application Note 391 - Altera
Create successful ePaper yourself
Turn your PDF publications into a flip-book with our unique Google optimized e-Paper software.
Using the GNU Profiler to Measure Code Performance Page 5<br />
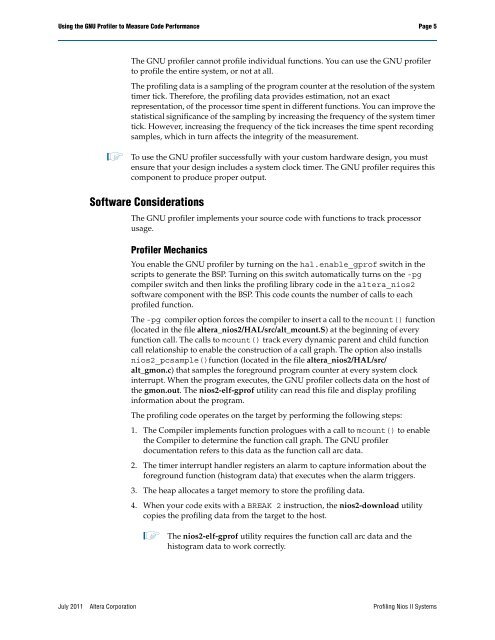
The GNU profiler cannot profile individual functions. You can use the GNU profiler<br />
to profile the entire system, or not at all.<br />
The profiling data is a sampling of the program counter at the resolution of the system<br />
timer tick. Therefore, the profiling data provides estimation, not an exact<br />
representation, of the processor time spent in different functions. You can improve the<br />
statistical significance of the sampling by increasing the frequency of the system timer<br />
tick. However, increasing the frequency of the tick increases the time spent recording<br />
samples, which in turn affects the integrity of the measurement.<br />
1 To use the GNU profiler successfully with your custom hardware design, you must<br />
ensure that your design includes a system clock timer. The GNU profiler requires this<br />
component to produce proper output.<br />
Software Considerations<br />
The GNU profiler implements your source code with functions to track processor<br />
usage.<br />
Profiler Mechanics<br />
You enable the GNU profiler by turning on the hal.enable_gprof switch in the<br />
scripts to generate the BSP. Turning on this switch automatically turns on the -pg<br />
compiler switch and then links the profiling library code in the altera_nios2<br />
software component with the BSP. This code counts the number of calls to each<br />
profiled function.<br />
The -pg compiler option forces the compiler to insert a call to the mcount() function<br />
(located in the file altera_nios2/HAL/src/alt_mcount.S) at the beginning of every<br />
function call. The calls to mcount() track every dynamic parent and child function<br />
call relationship to enable the construction of a call graph. The option also installs<br />
nios2_pcsample()function (located in the file altera_nios2/HAL/src/<br />
alt_gmon.c) that samples the foreground program counter at every system clock<br />
interrupt. When the program executes, the GNU profiler collects data on the host of<br />
the gmon.out. The nios2-elf-gprof utility can read this file and display profiling<br />
information about the program.<br />
The profiling code operates on the target by performing the following steps:<br />
1. The Compiler implements function prologues with a call to mcount() to enable<br />
the Compiler to determine the function call graph. The GNU profiler<br />
documentation refers to this data as the function call arc data.<br />
2. The timer interrupt handler registers an alarm to capture information about the<br />
foreground function (histogram data) that executes when the alarm triggers.<br />
3. The heap allocates a target memory to store the profiling data.<br />
4. When your code exits with a BREAK 2 instruction, the nios2-download utility<br />
copies the profiling data from the target to the host.<br />
1 The nios2-elf-gprof utility requires the function call arc data and the<br />
histogram data to work correctly.<br />
July 2011 <strong>Altera</strong> Corporation <strong>Profiling</strong> <strong>Nios</strong> <strong>II</strong> <strong>Systems</strong>


