Jose Hueb book 11.1
Jose Hueb book 11.1
Jose Hueb book 11.1

You also want an ePaper? Increase the reach of your titles
YUMPU automatically turns print PDFs into web optimized ePapers that Google loves.
7. Asia<br />
This chapter presents water supply and sanitation coverage data for Asia. Urban and rural water supply and sanitation coverage figures are<br />
shown by country, area or territory for both 1990 and 2000. Maps of current coverage are also presented. Graphs illustrate regional changes in<br />
coverage over time, as well as coverage targets associated with projected changes in population.<br />
7.1 Overview<br />
Data representing 94% of the Asian population suggest that only 48% of<br />
the population has sanitation coverage, by far the lowest of any region of<br />
the world (Table 5.1). The situation is even worse in rural areas, where<br />
only 31% of the population has improved sanitation, compared with<br />
78% coverage in urban areas. Total water coverage in Asia is also the<br />
second lowest, after Africa, at 81%. But again, water supply coverage is<br />
lower in rural areas (75%) compared with that in urban areas (93%).<br />
Because of the population sizes of China and India, along with other<br />
large nations in the region, Asia accounts for the vast majority of people<br />
in the world without access to improved services. Eighty percent of the<br />
global population without access to improved sanitation, and almost<br />
two-thirds without access to improved water supply, live in Asia.<br />
At present, approximately one-third of the Asian population is urban<br />
and two-thirds live in rural areas. But this balance is predicted to shift<br />
over the coming decades. By the year 2015, the urban population is<br />
projected to be 45% of the region’s total, and grow to just over one-half of<br />
the total Asian population by 2025. This population growth will place<br />
enormous strain on already over-burdened services, especially in urban<br />
centres. To meet the international development target of halving the<br />
proportion of people without access to improved services by 2015, an<br />
additional 1.5 billion people in Asia will need access to sanitation facilities,<br />
while an additional 980 million will need access to water supply.<br />
7.2 Water supply and sanitation coverage<br />
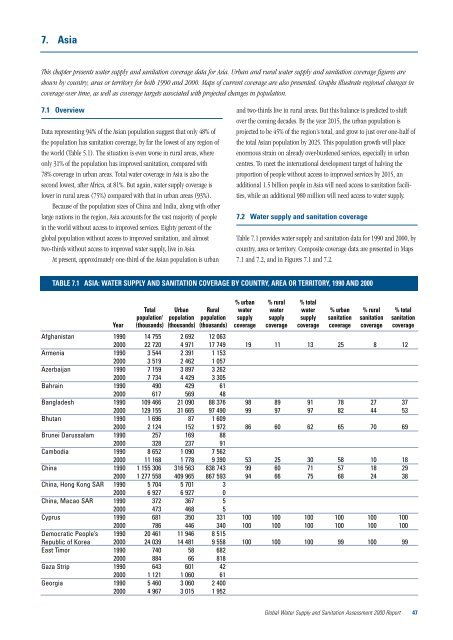
Table 7.1 provides water supply and sanitation data for 1990 and 2000, by<br />
country, area or territory. Composite coverage data are presented in Maps<br />
7.1 and 7.2, and in Figures 7.1 and 7.2.<br />
TABLE 7.1 ASIA: WATER SUPPLY AND SANITATION COVERAGE BY COUNTRY, AREA OR TERRITORY, 1990 AND 2000<br />
Year<br />
Total<br />
population 1<br />
(thousands)<br />
Urban<br />
population<br />
(thousands)<br />
Rural<br />
population<br />
(thousands)<br />
% urban<br />
water<br />
supply<br />
coverage<br />
% rural<br />
water<br />
supply<br />
coverage<br />
% total<br />
water<br />
supply<br />
coverage<br />
% urban<br />
sanitation<br />
coverage<br />
% rural<br />
sanitation<br />
coverage<br />
% total<br />
sanitation<br />
coverage<br />
Afghanistan 1990 14 755 2 692 12 063<br />
2000 22 720 4 971 17 749 19 11 13 25 8 12<br />
Armenia 1990 3 544 2 391 1 153<br />
2000 3 519 2 462 1 057<br />
Azerbaijan 1990 7 159 3 897 3 262<br />
2000 7 734 4 429 3 305<br />
Bahrain 1990 490 429 61<br />
2000 617 569 48<br />
Bangladesh 1990 109 466 21 090 88 376 98 89 91 78 27 37<br />
2000 129 155 31 665 97 490 99 97 97 82 44 53<br />
Bhutan 1990 1 696 87 1 609<br />
2000 2 124 152 1 972 86 60 62 65 70 69<br />
Brunei Darussalam 1990 257 169 88<br />
2000 328 237 91<br />
Cambodia 1990 8 652 1 090 7 562<br />
2000 11 168 1 778 9 390 53 25 30 58 10 18<br />
China 1990 1 155 306 316 563 838 743 99 60 71 57 18 29<br />
2000 1 277 558 409 965 867 593 94 66 75 68 24 38<br />
China, Hong Kong SAR 1990 5 704 5 701 3<br />
2000 6 927 6 927 0<br />
China, Macao SAR 1990 372 367 5<br />
2000 473 468 5<br />
Cyprus 1990 681 350 331 100 100 100 100 100 100<br />
2000 786 446 340 100 100 100 100 100 100<br />
Democratic People’s 1990 20 461 11 946 8 515<br />
Republic of Korea 2000 24 039 14 481 9 558 100 100 100 99 100 99<br />
East Timor 1990 740 58 682<br />
2000 884 66 818<br />
Gaza Strip 1990 643 601 42<br />
2000 1 121 1 060 61<br />
Georgia 1990 5 460 3 060 2 400<br />
2000 4 967 3 015 1 952<br />
Global Water Supply and Sanitation Assessment 2000 Report 47