Jose Hueb book 11.1
Jose Hueb book 11.1
Jose Hueb book 11.1

Create successful ePaper yourself
Turn your PDF publications into a flip-book with our unique Google optimized e-Paper software.
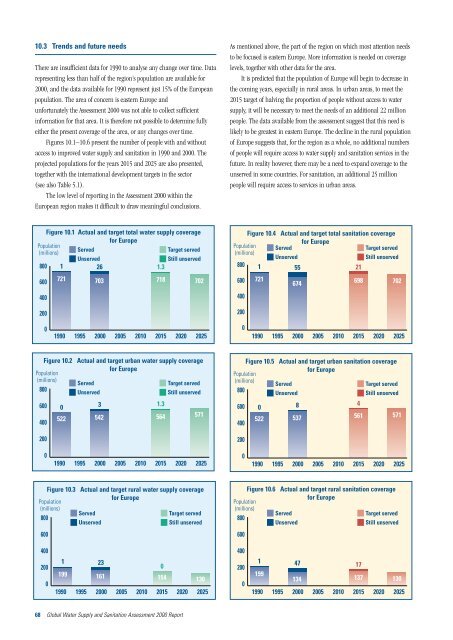
10.3 Trends and future needs<br />
There are insufficient data for 1990 to analyse any change over time. Data<br />
representing less than half of the region’s population are available for<br />
2000, and the data available for 1990 represent just 15% of the European<br />
population. The area of concern is eastern Europe and<br />
unfortunately the Assessment 2000 was not able to collect sufficient<br />
information for that area. It is therefore not possible to determine fully<br />
either the present coverage of the area, or any changes over time.<br />
Figures 10.1–10.6 present the number of people with and without<br />
access to improved water supply and sanitation in 1990 and 2000. The<br />
projected populations for the years 2015 and 2025 are also presented,<br />
together with the international development targets in the sector<br />
(see also Table 5.1).<br />
The low level of reporting in the Assessment 2000 within the<br />
European region makes it difficult to draw meaningful conclusions.<br />
Figure 10.1 Actual and target total water supply coverage<br />
Population<br />
(millions)<br />
Served<br />
Unserved<br />
for Europe<br />
Target served<br />
Still unserved<br />
800 1<br />
26 1.3<br />
600<br />
400<br />
200<br />
0<br />
600<br />
400<br />
200<br />
0<br />
721<br />
703 718 702<br />
1990 1995 2000 2005 2010 2015 2020 2025<br />
Figure 10.2 Actual and target urban water supply coverage<br />
Population<br />
for Europe<br />
(millions)<br />
800<br />
Served<br />
Unserved<br />
Target served<br />
Still unserved<br />
400<br />
200<br />
0<br />
0<br />
522<br />
3 1.3<br />
542 564 571<br />
1990 1995 2000 2005 2010 2015 2020 2025<br />
Figure 10.3 Actual and target rural water supply coverage<br />
Population<br />
for Europe<br />
(millions)<br />
800<br />
600<br />
Served<br />
Unserved<br />
Target served<br />
Still unserved<br />
1<br />
199<br />
23<br />
161 154 130<br />
1990 1995 2000 2005 2010 2015 2020 2025<br />
68 Global Water Supply and Sanitation Assessment 2000 Report<br />
0<br />
As mentioned above, the part of the region on which most attention needs<br />
to be focused is eastern Europe. More information is needed on coverage<br />
levels, together with other data for the area.<br />
It is predicted that the population of Europe will begin to decrease in<br />
the coming years, especially in rural areas. In urban areas, to meet the<br />
2015 target of halving the proportion of people without access to water<br />
supply, it will be necessary to meet the needs of an additional 22 million<br />
people. The data available from the assessment suggest that this need is<br />
likely to be greatest in eastern Europe. The decline in the rural population<br />
of Europe suggests that, for the region as a whole, no additional numbers<br />
of people will require access to water supply and sanitation services in the<br />
future. In reality however, there may be a need to expand coverage to the<br />
unserved in some countries. For sanitation, an additional 25 million<br />
people will require access to services in urban areas.<br />
Figure 10.4 Actual and target total sanitation coverage<br />
Population<br />
(millions)<br />
Served<br />
Unserved<br />
for Europe<br />
Target served<br />
Still unserved<br />
800 1<br />
55 21<br />
600<br />
400<br />
721<br />
674<br />
698 702<br />
200<br />
0<br />
600<br />
400<br />
200<br />
0<br />
1990 1995 2000 2005 2010 2015 2020 2025<br />
Figure 10.5 Actual and target urban sanitation coverage<br />
Population<br />
for Europe<br />
(millions)<br />
800<br />
Served<br />
Unserved<br />
Target served<br />
Still unserved<br />
400<br />
200<br />
0<br />
0<br />
522<br />
8<br />
537 561 571<br />
1990 1995 2000 2005 2010 2015 2020 2025<br />
Figure 10.6 Actual and target rural sanitation coverage<br />
Population<br />
for Europe<br />
(millions)<br />
800<br />
600<br />
Served<br />
Unserved<br />
Target served<br />
Still unserved<br />
1<br />
199<br />
47 17<br />
134 137 130<br />
1990 1995 2000 2005 2010 2015 2020 2025<br />
4