Jose Hueb book 11.1
Jose Hueb book 11.1
Jose Hueb book 11.1

You also want an ePaper? Increase the reach of your titles
YUMPU automatically turns print PDFs into web optimized ePapers that Google loves.
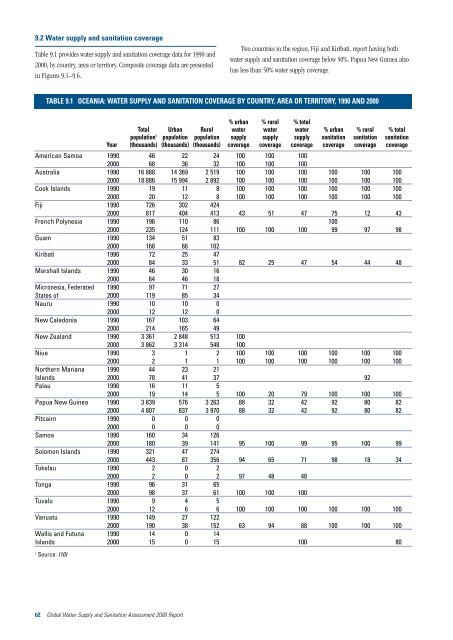
9.2 Water supply and sanitation coverage<br />
Table 9.1 provides water supply and sanitation coverage data for 1990 and<br />
2000, by country, area or territory. Composite coverage data are presented<br />
in Figures 9.1–9.6.<br />
Two countries in the region, Fiji and Kiribati, report having both<br />
water supply and sanitation coverage below 50%. Papua New Guinea also<br />
has less than 50% water supply coverage.<br />
TABLE 9.1 OCEANIA: WATER SUPPLY AND SANITATION COVERAGE BY COUNTRY, AREA OR TERRITORY, 1990 AND 2000<br />
Year<br />
Total<br />
population 1<br />
(thousands)<br />
Urban<br />
population<br />
(thousands)<br />
American Samoa 1990 46 22 24 100 100 100<br />
2000 68 36 32 100 100 100<br />
Australia 1990 16 888 14 369 2 519 100 100 100 100 100 100<br />
2000 18 886 15 994 2 892 100 100 100 100 100 100<br />
Cook Islands 1990 19 11 8 100 100 100 100 100 100<br />
2000 20 12 8 100 100 100 100 100 100<br />
Fiji 1990 726 302 424<br />
2000 817 404 413 43 51 47 75 12 43<br />
French Polynesia 1990 196 110 86 100<br />
2000 235 124 111 100 100 100 99 97 98<br />
Guam 1990 134 51 83<br />
2000 168 66 102<br />
Kiribati 1990 72 25 47<br />
2000 84 33 51 82 25 47 54 44 48<br />
Marshall Islands 1990 46 30 16<br />
2000 64 46 18<br />
Micronesia, Federated 1990 97 71 27<br />
States of 2000 119 85 34<br />
Nauru 1990 10 10 0<br />
2000 12 12 0<br />
New Caledonia 1990 167 103 64<br />
2000 214 165 49<br />
New Zealand 1990 3 361 2 848 513 100<br />
2000 3 862 3 314 548 100<br />
Niue 1990 3 1 2 100 100 100 100 100 100<br />
2000 2 1 1 100 100 100 100 100 100<br />
Northern Mariana 1990 44 23 21<br />
Islands 2000 78 41 37 92<br />
Palau 1990 16 11 5<br />
2000 19 14 5 100 20 79 100 100 100<br />
Papua New Guinea 1990 3 839 576 3 263 88 32 42 92 80 82<br />
2000 4 807 837 3 970 88 32 42 92 80 82<br />
Pitcairn 1990 0 0 0<br />
2000 0 0 0<br />
Samoa 1990 160 34 126<br />
2000 180 39 141 95 100 99 95 100 99<br />
Solomon Islands 1990 321 47 274<br />
2000 443 87 356 94 65 71 98 18 34<br />
Tokelau 1990 2 0 2<br />
2000 2 0 2 97 48 48<br />
Tonga 1990 96 31 65<br />
2000 98 37 61 100 100 100<br />
Tuvalu 1990 9 4 5<br />
2000 12 6 6 100 100 100 100 100 100<br />
Vanuatu 1990 149 27 122<br />
2000 190 38 152 63 94 88 100 100 100<br />
Wallis and Futuna 1990 14 0 14<br />
Islands 2000 15 0 15 100 80<br />
1 Source: (10)<br />
62 Global Water Supply and Sanitation Assessment 2000 Report<br />
Rural<br />
population<br />
(thousands)<br />
% urban<br />
water<br />
supply<br />
coverage<br />
% rural<br />
water<br />
supply<br />
coverage<br />
% total<br />
water<br />
supply<br />
coverage<br />
% urban<br />
sanitation<br />
coverage<br />
% rural<br />
sanitation<br />
coverage<br />
% total<br />
sanitation<br />
coverage