Jose Hueb book 11.1
Jose Hueb book 11.1
Jose Hueb book 11.1

You also want an ePaper? Increase the reach of your titles
YUMPU automatically turns print PDFs into web optimized ePapers that Google loves.
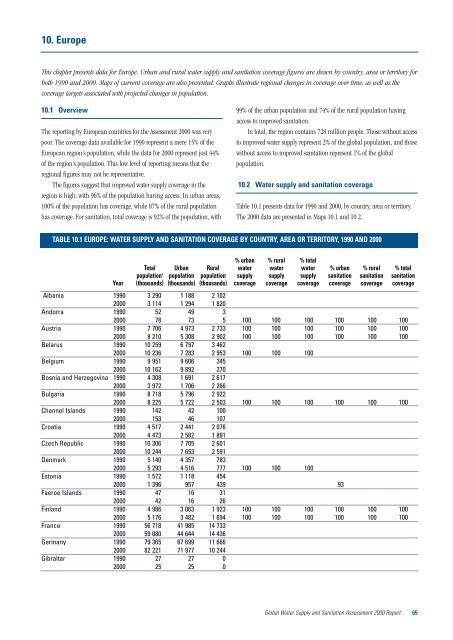
10. Europe<br />
This chapter presents data for Europe. Urban and rural water supply and sanitation coverage figures are shown by country, area or territory for<br />
both 1990 and 2000. Maps of current coverage are also presented. Graphs illustrate regional changes in coverage over time, as well as the<br />
coverage targets associated with projected changes in population.<br />
10.1 Overview<br />
The reporting by European countries for the Assessment 2000 was very<br />
poor. The coverage data available for 1990 represent a mere 15% of the<br />
European region’s population, while the data for 2000 represent just 44%<br />
of the region’s population. This low level of reporting means that the<br />
regional figures may not be representative.<br />
The figures suggest that improved water supply coverage in the<br />
region is high, with 96% of the population having access. In urban areas,<br />
100% of the population has coverage, while 87% of the rural population<br />
has coverage. For sanitation, total coverage is 92% of the population, with<br />
99% of the urban population and 74% of the rural population having<br />
access to improved sanitation.<br />
In total, the region contains 728 million people. Those without access<br />
to improved water supply represent 2% of the global population, and those<br />
without access to improved sanitation represent 1% of the global<br />
population.<br />
10.2 Water supply and sanitation coverage<br />
Table 10.1 presents data for 1990 and 2000, by country, area or territory.<br />
The 2000 data are presented in Maps 10.1 and 10.2.<br />
TABLE 10.1 EUROPE: WATER SUPPLY AND SANITATION COVERAGE BY COUNTRY, AREA OR TERRITORY, 1990 AND 2000<br />
Year<br />
Total<br />
population 1<br />
(thousands)<br />
Urban<br />
population<br />
(thousands)<br />
Rural<br />
population<br />
(thousands)<br />
% urban<br />
water<br />
supply<br />
coverage<br />
% rural<br />
water<br />
supply<br />
coverage<br />
% total<br />
water<br />
supply<br />
coverage<br />
% urban<br />
sanitation<br />
coverage<br />
% rural<br />
sanitation<br />
coverage<br />
% total<br />
sanitation<br />
coverage<br />
Albania 1990 3 290 1 188 2 102<br />
2000 3 114 1 294 1 820<br />
Andorra 1990 52 49 3<br />
2000 78 73 5 100 100 100 100 100 100<br />
Austria 1990 7 706 4 973 2 733 100 100 100 100 100 100<br />
2000 8 210 5 308 2 902 100 100 100 100 100 100<br />
Belarus 1990 10 259 6 797 3 462<br />
2000 10 236 7 283 2 953 100 100 100<br />
Belgium 1990 9 951 9 606 345<br />
2000 10 162 9 892 270<br />
Bosnia and Herzegovina 1990 4 308 1 691 2 617<br />
2000 3 972 1 706 2 266<br />
Bulgaria 1990 8 718 5 796 2 922<br />
2000 8 225 5 722 2 503 100 100 100 100 100 100<br />
Channel Islands 1990 142 42 100<br />
2000 153 46 107<br />
Croatia 1990 4 517 2 441 2 076<br />
2000 4 473 2 582 1 891<br />
Czech Republic 1990 10 306 7 705 2 601<br />
2000 10 244 7 653 2 591<br />
Denmark 1990 5 140 4 357 783<br />
2000 5 293 4 516 777 100 100 100<br />
Estonia 1990 1 572 1 118 454<br />
2000 1 396 957 439 93<br />
Faeroe Islands 1990 47 16 31<br />
2000 42 16 26<br />
Finland 1990 4 986 3 063 1 923 100 100 100 100 100 100<br />
2000 5 176 3 482 1 694 100 100 100 100 100 100<br />
France 1990 56 718 41 985 14 733<br />
2000 59 080 44 644 14 436<br />
Germany 1990 79 365 67 699 11 666<br />
2000 82 221 71 977 10 244<br />
Gibraltar 1990 27 27 0<br />
2000 25 25 0<br />
Global Water Supply and Sanitation Assessment 2000 Report 65