Jose Hueb book 11.1
Jose Hueb book 11.1
Jose Hueb book 11.1

You also want an ePaper? Increase the reach of your titles
YUMPU automatically turns print PDFs into web optimized ePapers that Google loves.
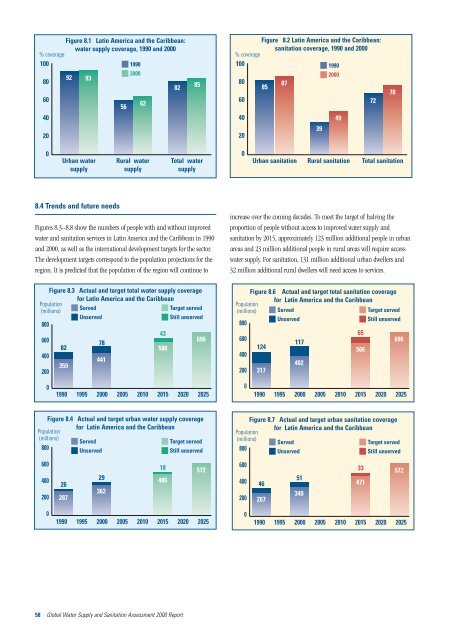
Figure 8.1 Latin America and the Caribbean:<br />
water supply coverage, 1990 and 2000<br />
% coverage<br />
100<br />
1990<br />
80<br />
92 93<br />
2000<br />
82<br />
60<br />
40<br />
56<br />
62<br />
20<br />
0<br />
8.4 Trends and future needs<br />
Figures 8.3–8.8 show the numbers of people with and without improved<br />
water and sanitation services in Latin America and the Caribbean in 1990<br />
and 2000, as well as the international development targets for the sector.<br />
The development targets correspond to the population projections for the<br />
region. It is predicted that the population of the region will continue to<br />
Figure 8.3 Actual and target total water supply coverage<br />
Population<br />
(millions)<br />
800<br />
for Latin America and the Caribbean<br />
Served<br />
Target served<br />
Unserved<br />
Still unserved<br />
600<br />
82<br />
78<br />
43<br />
588<br />
696<br />
400<br />
200<br />
359<br />
441<br />
0<br />
600<br />
400<br />
200<br />
0<br />
Urban water<br />
supply<br />
1990 1995 2000 2005 2010 2015 2020 2025<br />
Figure 8.4 Actual and target urban water supply coverage<br />
Population<br />
for Latin America and the Caribbean<br />
(millions)<br />
800<br />
Served<br />
Unserved<br />
Target served<br />
Still unserved<br />
26<br />
287<br />
29<br />
362<br />
Rural water<br />
supply<br />
486<br />
1990 1995 2000 2005 2010 2015 2020 2025<br />
58 Global Water Supply and Sanitation Assessment 2000 Report<br />
18<br />
Total water<br />
supply<br />
Figure 8.2 Latin America and the Caribbean:<br />
sanitation coverage, 1990 and 2000<br />
% coverage<br />
100<br />
1990<br />
2000<br />
85<br />
80<br />
85<br />
87<br />
60<br />
72<br />
572<br />
40<br />
20<br />
0<br />
increase over the coming decades. To meet the target of halving the<br />
proportion of people without access to improved water supply and<br />
sanitation by 2015, approximately 123 million additional people in urban<br />
areas and 23 million additional people in rural areas will require access<br />
water supply. For sanitation, 131 million additional urban dwellers and<br />
32 million additional rural dwellers will need access to services.<br />
Figure 8.6 Actual and target total sanitation coverage<br />
Population<br />
(millions)<br />
for Latin America and the Caribbean<br />
Served<br />
Target served<br />
800<br />
Unserved<br />
Still unserved<br />
600<br />
400<br />
124<br />
117<br />
402<br />
65<br />
566<br />
696<br />
200 317<br />
0<br />
600<br />
400<br />
200<br />
0<br />
Urban sanitation Rural sanitation Total sanitation<br />
1990 1995 2000 2005 2010 2015 2020 2025<br />
Figure 8.7 Actual and target urban sanitation coverage<br />
Population<br />
for Latin America and the Caribbean<br />
(millions)<br />
800<br />
Served<br />
Unserved<br />
Target served<br />
Still unserved<br />
46<br />
267<br />
51<br />
340<br />
39<br />
471<br />
572<br />
1990 1995 2000 2005 2010 2015 2020 2025<br />
49<br />
33<br />
78