Output frequency response function-based analysis for nonlinear ...
Output frequency response function-based analysis for nonlinear ...
Output frequency response function-based analysis for nonlinear ...

You also want an ePaper? Increase the reach of your titles
YUMPU automatically turns print PDFs into web optimized ePapers that Google loves.
114<br />
Magnitude<br />
Magnitude of the sensitivity <strong>function</strong>s (10e-5)<br />
350<br />
300<br />
250<br />
200<br />
150<br />
100<br />
50<br />
ARTICLE IN PRESS<br />
X.J. Jing et al. / Mechanical Systems and Signal Processing 22 (2008) 102–120<br />
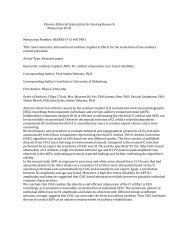
<strong>Output</strong> <strong>frequency</strong> <strong>response</strong> fuctions<br />
c1<br />
Simulation data<br />
c4<br />
Simulation data<br />
c2<br />
Simulation data<br />
c3<br />
Simulation data<br />
Simulation tests<br />
0 1 2 3 4 5 6 7 8 9<br />
x 107 0<br />
Nonlinear parameters c1,c2,c3 and c4<br />
Fig. 2. <strong>Output</strong> <strong>frequency</strong> <strong>response</strong> <strong>function</strong>s with respect to c 1 to c 4, respectively.<br />
10<br />
5<br />
0<br />
-5<br />
-10<br />
-15<br />
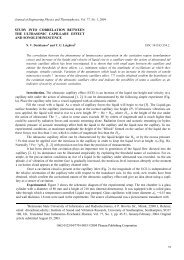
Sensitivity of OFRF to <strong>nonlinear</strong> parameters<br />
1 2 3 4 5 6 7 8 9 10 11<br />
x 106 Nonlinear parameters c1, c2 and c3<br />
Fig. 3. Sensitivity <strong>function</strong> of the OFRFs with respect to c1 to c3, respectively.<br />
convergence of the output spectrum corresponding to c 2 should be larger. Simulation tests verify that the<br />
system is still stable when c 2 ¼ 10 17 where the magnitude of the output spectrum is 0.0216, while the system<br />
tends to be unstable when c 1 tends to be larger than 10 8 .<br />
c1<br />
c2<br />
c3