Output frequency response function-based analysis for nonlinear ...
Output frequency response function-based analysis for nonlinear ...
Output frequency response function-based analysis for nonlinear ...

You also want an ePaper? Increase the reach of your titles
YUMPU automatically turns print PDFs into web optimized ePapers that Google loves.
116<br />
ARTICLE IN PRESS<br />
X.J. Jing et al. / Mechanical Systems and Signal Processing 22 (2008) 102–120<br />
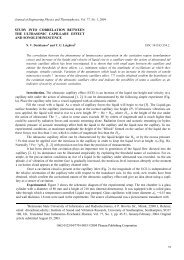
In order to construct the non-singular matrix c, the series of r(N) ¼ 55 different points c ¼ [c1, c2, c3] inqSC ¼<br />
fc ¼½c1; c2; c3Šjc1 2½0; 1Š; c2 2½0; 6Š; c3 2½0; 5Šg can be obtained by using a simple stochastic-<strong>based</strong> searching<br />
method. In simulations, it is noticed that is easy to find such a series of points that det(c)6¼0. For example, a series of<br />
points c ¼ [c1, c2, c3] are illustrated in Fig. 5, and it can be obtained in this case that det(c) ¼ 0.08608811188201. It<br />
can be seen from simulations that it is easy to find a non-singular matrix c with a proper inverse.<br />
Then following the same procedure as demonstrated above, the OFRF Y(jo; c1, c2, c3) in this case can be<br />
obtained. The results are shown in Figs. 6 and 7. It can be seen that<br />
(1) By using the OFRF, the output spectrum can be plotted and analyzed under different combinations of the<br />
<strong>nonlinear</strong> parameters c1, c2 and c3. This provides a straight<strong>for</strong>ward understanding of the relationship<br />
between system output spectrum and model parameters that define <strong>nonlinear</strong>ities.<br />
6<br />
5<br />
4<br />
3<br />
2<br />
1<br />
0<br />
0 10 20 30 40 50 60<br />
Different values of c1, c2 and c3<br />
Fig. 5. A series of 55 points c ¼ [c1,c2,c3].<br />
Fig. 6. <strong>Output</strong> spectrums with respect to c 1, c 2 and c 3.<br />
c1<br />
c2<br />
c3