You also want an ePaper? Increase the reach of your titles
YUMPU automatically turns print PDFs into web optimized ePapers that Google loves.
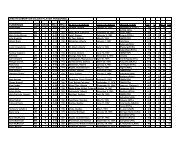
<strong>EDMONTON</strong> <strong>OILERS</strong> YEAR-BY-YEAR SPECIAL TEAMS (1979-80 TO 2011-12)<br />
POWERPLAY PENALTY KILLING PENALTY MINUTES SHG<br />
SEASON GP GF OPP PCT. RANK GA OPP PCT. RANK MINS AVG. BMI RANK F-A RANK<br />
1979-80 80 61 282 21.6 11/21 74 315 76.5 14/21 1528 19.1 16 3/21 11-4 2/4<br />
1980-81 80 77 347 22.2 12/21 85 348 75.6 14/21 1544 19.3 18 14/21 13-7 4/4<br />
1981-82 80 86 341 25.2 4/21 67 371 81.9 1/21 1473 18.4 20 11/21 12-8 4/8<br />
1982-83 80 86 294 29.3 1/21 89 396 77.5 9/21 1771 22.1 28 2/21 22-6 1/2<br />
1983-84 80 81 318 25.5 2/21 77 386 80.1 6/21 1577 19.7 18 7/21 36-12 1/13<br />
1984-85 80 74 293 25.3 2/21 76 353 78.5 9/21 1567 19.6 12 7/21 25-5 1/1<br />
1985-86 80 78 295 26.4 1/21 77 409 81.2 3/21 1928 24.1 28 5/21 27-15 1/17<br />
1986-87 80 79 318 22.0 7/21 74 372 80.1 9/21 1721 21.5 26 14/21 28-8 1/5<br />
1987-88 80 88 402 21.9 7/21 86 447 80.8 7/21 2173 27.2 22 12/21 20-11 2/7<br />
1988-89 80 83 419 19.8 16/21 78 452 82.7 2/21 1931 24.1 20 11/21 27-17 1/19<br />
1989-90 80 84 407 20.6 12/21 82 417 80.3 10/21 2046 25.6 22 9/21 22-6 1/2<br />
1990-91 80 63 361 17.5 17/21 80 388 79.4 15/21 1823 22.8 22 14/21 13-4 6/1<br />
1991-92 80 68 366 18.6 14/22 93 423 78.0 20/22 1907 23.8 24 10/22 12-15 8/20<br />
1992-93 84 66 416 15.9 23/24 106 464 77.2 21/24 2027 24.1 14 6/24 17-10 6/5<br />
1993-94 84 74 402 18.4 15/26 78 401 80.5 20/26 1858 22.1 12 8/26 2-9 26/5<br />
1994-95 48 42 259 16.2 18/26 52 233 77.7 25/26 1183 24.6 12 2/26 8-8 4/21<br />
1995-96 82 72 452 15.9 20/26 80 417 80.8 18/26 1709 20.8 12 9/26 10-12 17/14<br />
1996-97 82 73 406 18.0 6/26 59 338 82.5 18/26 1368 16.7 18 19/26 9-13 16/22<br />
1997-98 82 77 483 15.9 12/26 66 406 83.7 22/26 1690 20.6 10 9/26 10-11 13/15<br />
1998-99 82 63 438 14.4 17/27 67 374 82.1 21/27 1373 16.7 12 11/26 8-10 8/18<br />
1999-00 82 53 336 15.8 17/28 54 369 85.4 10/28 1344 16.4 16 5/28 9-4 7/3<br />
2000-01 82 59 398 14.8 21/30 62 382 83.8 16/30 1287 15.7 10 13/30 13-4 5/2<br />
2001-02 82 51 333 15.3 16/30 50 348 85.6 12/30 1267 15.5 6 10/30 12-7 4/12<br />
2002-03 82 56 386 14.5 19/30 61 351 82.6 19/30 1203 14.7 16 13/30 13-8 1/14<br />
2003-04 82 44 338 13.0 29/30 66 349 81.1 27/30 1220 14.9 22 16/30 13-8 4/13<br />
2004-05 – – – – – – – – – – – – – – –<br />
2005-06 82 88 485 18.1 14/30 76 478 84.1 8/30 1204 14.7 22 19/30 15-5 4/1<br />
2006-07 82 53 373 14.2 27/30 59 382 84.6 8/30 1263 15.7 22 25/30 6-4 21/2<br />
2007-08 82 57 344 16.6 20/30 56 366 84.7 5/30 1175 14.3 26 19/30 7-10 16/21<br />
2008-09 82 60 354 17.0 21/30 76 338 77.5 27/30 1247 15.0 20 7/30 3-8 29/14<br />
2009-10 82 52 301 17.3 18/30 67 305 78.0 26/30 1115 13.8 9 20/30 6-5 18/10<br />
2010-11 82 44 304 14.5 27/30 82 321 77.0 29/30 1270 15.5 20 28/30 8-2 3/3<br />
2011-12 82 54 262 20.6 3/30 52 296 82.4 14/30 942 11.5 20 18/30 5-8 14/21<br />
NOTE:<br />
- Rank in penalty minutes is based on most to fewest PIM. For example, in 1979-80 the Oilers were the 3rd most penalized<br />
team in the NHL.<br />
- Rank in shorthanded goals (SHG) is based on most SHG for and on fewest SHG against. For example, in 1979-80 the Oilers<br />
had the second most shorthanded goals for and the fourth fewest shorthanded goals against.<br />
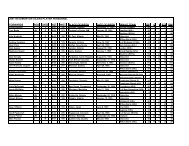
SPECIAL TEAMS<br />
<strong>OILERS</strong> 2011-12 POWER PLAY STATS<br />
Goals Attempts % Rank<br />
Overall 54 262 20.6 3rd<br />
Home 30 139 21.6 3rd<br />
Road 24 123 19.5 11th<br />
Oilers record when… W-L-OTL-L/SO<br />
Oilers score 0 PPG 10-26-7<br />
Oilers score 1 PPG 13-10-3<br />
Oilers score 2 PPG 8-4-0<br />
Oilers score 3+ PPG 1-0-0<br />
2 Man PP Goals 2-Man Advantages %<br />
Overall 2 10 20.0<br />
Home 1 6 16.6<br />
Road 1 4 25.0<br />
Total Time on 2-Man PP: 6:16<br />
Average 2-Man PP Time: 0:38<br />
<strong>OILERS</strong> 2011-12 PENALTY KILLING STATS<br />
Goals Disadvantages % Rank<br />
Overall 52 296 82.4 14th<br />
Home 27 149 81.9 21st<br />
Road 25 147 83.0 13th<br />
Oilers record when… W-L-OTL-L/SO<br />
Oilers allow no PPG 21-16-6<br />
Oilers allow 1 PPG 9-13-4<br />
Oilers allow 2 PPG 2-11-0<br />
Oilers allow 3+ PPG 0-0-0<br />
2 Man PK Goals Allowed 2-Man Disadvantages %<br />
Overall 2 20 90.0<br />
Home 1 9 88.9<br />
Road 1 11 90.0<br />
Total Time on 2-Man PK: 14:59<br />
Average 2-Man PK Time: 0:45<br />
179