

Climate Change and Switzerland 2050 - OcCC - SCNAT
Climate Change and Switzerland 2050 - OcCC - SCNAT
Climate Change and Switzerland 2050 - OcCC - SCNAT

You also want an ePaper? Increase the reach of your titles
YUMPU automatically turns print PDFs into web optimized ePapers that Google loves.
12 <strong>Climate</strong> <strong>Change</strong> <strong>and</strong> Switzerl<strong>and</strong> <strong>2050</strong> | Background<br />
1. The future climate of Switzerl<strong>and</strong><br />
Observed changes during the<br />
20 th century<br />
During the 20 th century, the mean global temperature<br />
increased by about 0.6 °C. 1 In Switzerl<strong>and</strong><br />
– like in other continental regions – the warming<br />
was stronger than the global average. In the<br />
20 th century, the temperature increase was about<br />
1.6 °C in western Switzerl<strong>and</strong>, about 1.3 °C in<br />
the German-speaking part of Switzerl<strong>and</strong> <strong>and</strong><br />
about 1 °C south of the Alps. North of the<br />
Alps, the frequency of abnormally warm months,<br />
that is, months with an average temperature<br />
more than 2 °C above the long-term mean, had<br />
already increased by about 70%. 2 The precipitation<br />
regime had changed as well. Annual rainfall<br />
increased by about 120 mm (8%) during the 20 th<br />
century. In the northern <strong>and</strong> western part of the<br />
alpine area, mean winter precipitation increased<br />
by about 20 to 30%. 3 Heavy daily precipitation<br />
<strong>and</strong> heavy precipitation lasting between 2 to 5<br />
days increased in autumn <strong>and</strong> winter in large<br />
parts of the midl<strong>and</strong>s <strong>and</strong> the northern edge of<br />
the Alps. 4 Since evaporation rose in parallel to<br />
the warming by 105 mm (23%), the mean annual<br />
runoff remained virtually the same. At the same<br />
time, water reserves linked to glaciers decreased<br />
by about 50 cubic kilometres over 100 years. This<br />
decrease in the glacier volume contributed on<br />
average about 12 mm/a (1.2%) to the runoff.<br />
Latitude<br />
46 47 48 49<br />
43 44 45<br />
46 47 48 49<br />
CHN<br />
CHS<br />
4 6 8 10 12 14 16<br />
Longitude<br />
Temperature <strong>and</strong><br />
precipitation scenarios<br />
In the future, climate change will accelerate.<br />
Depending on how greenhouse gas emissions<br />
develop, an increase of 0.8 to 2.4 °C in the global<br />
temperature by <strong>2050</strong> <strong>and</strong> 1.4 to 5.8 °C by<br />
the end of the 21 st century compared to 1990<br />
must be expected, unless drastic emission reduction<br />
measures are taken. 1,5 The water cycle will<br />
change as well (see fig. 4). However, climate<br />
change will not affect all regions in the same<br />
manner. How will the climate in Switzerl<strong>and</strong><br />
change in the future? Regional changes are<br />
distinctly more difficult to estimate because<br />
the respective surroundings (relief, distance<br />
from the sea, local wind patterns <strong>and</strong> their<br />
oscillations, etc.) have a significant impact. This<br />
report is based on a regional temperature <strong>and</strong><br />
precipitation scenario for Switzerl<strong>and</strong>. 6 The calculations<br />
of various combinations of global <strong>and</strong><br />
regional climate models from the EU-project<br />
PRUDENCE 7 provided the basis for the calculations<br />
that enabled the uncertainties in the<br />
physical underst<strong>and</strong>ing of the climate system to<br />
be estimated.<br />
In a second step, the dependency of the results<br />
on the future trend of emissions was taken into<br />
consideration. However, possible political measures<br />
to reduce greenhouse gas emissions (e.g.,<br />
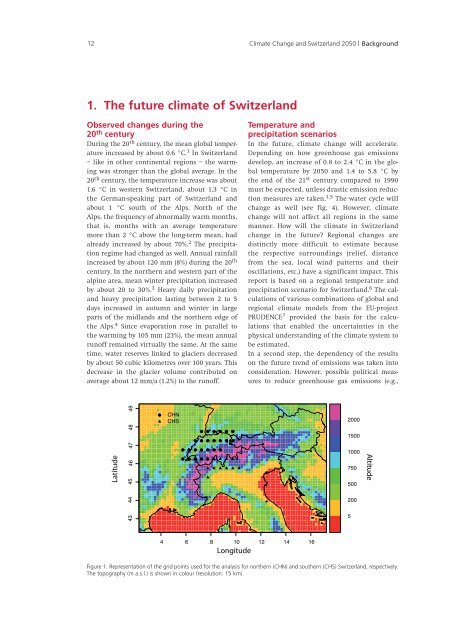
Figure 1: Representation of the grid points used for the analysis for northern (CHN) <strong>and</strong> southern (CHS) Switzerl<strong>and</strong>, respectively.<br />
The topography (m a.s.l.) is shown in colour (resolution: 15 km).<br />
2000<br />
1500<br />
1000<br />
750<br />
500<br />
200<br />
5<br />
Altitude


