

Climate Change and Switzerland 2050 - OcCC - SCNAT
Climate Change and Switzerland 2050 - OcCC - SCNAT
Climate Change and Switzerland 2050 - OcCC - SCNAT

Create successful ePaper yourself
Turn your PDF publications into a flip-book with our unique Google optimized e-Paper software.
16 <strong>Climate</strong> <strong>Change</strong> <strong>and</strong> Switzerl<strong>and</strong> <strong>2050</strong> | Background<br />
The circumstances are also very similar for precipitation<br />
for the northern <strong>and</strong> southern sides of<br />
the Alps. The changes in the various regions differ<br />
in all seasons by only a few percent (fig. 4). On<br />
the northern side of the Alps, an increase of 8%<br />
is expected in winter (11% on the southern side)<br />
<strong>and</strong> a decrease of 17% in summer (19% on the<br />
southern side) by the middle of the 21 st century.<br />
In spring <strong>and</strong> autumn, precipitation increases<br />
or decreases are possible. In summer, the area of<br />
uncertainty is particularly large.<br />
The calculated absolute precipitation changes<br />
in Bern Liebefeld, Sion <strong>and</strong> Lugano are shown<br />
in figure 5. Generally, annual precipitation will<br />
decrease slightly (-50 mm in Bern Liebefeld, -20<br />
mm in Sion, -150 mm in Lugano).<br />
Assessment of changes<br />
How can climate change be assessed? Will the<br />
climate in Bern in <strong>2050</strong> be like in Rome today? In<br />
order to answer this question, climate scenarios<br />
for different measuring stations of MeteoSwiss<br />
were compared to today’s conditions. The comparison<br />
is complicated by the fact that temperatures<br />
<strong>and</strong> precipitation depend to a large extent<br />
Temperature<br />
25<br />
20<br />
15<br />
10<br />
5<br />
0<br />
Zurich-MeteoSwiss today<br />
Zurich-MeteoSwiss in <strong>2050</strong><br />
Sion today<br />
Magadino today<br />
Torino today<br />
Jan March May July Sep Nov<br />
Month<br />
on the topography, the geographical position<br />
<strong>and</strong> other local factors. For precipitation, the<br />
comparison of the stations does not result in<br />
a consistent picture <strong>and</strong> therefore makes little<br />
sense.<br />
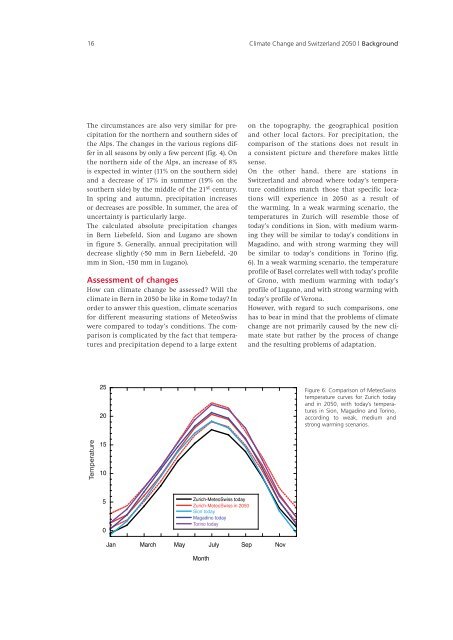
On the other h<strong>and</strong>, there are stations in<br />
Switzerl<strong>and</strong> <strong>and</strong> abroad where today’s temperature<br />
conditions match those that specific locations<br />
will experience in <strong>2050</strong> as a result of<br />
the warming. In a weak warming scenario, the<br />
temperatures in Zurich will resemble those of<br />
today’s conditions in Sion, with medium warming<br />
they will be similar to today’s conditions in<br />
Magadino, <strong>and</strong> with strong warming they will<br />
be similar to today’s conditions in Torino (fig.<br />
6). In a weak warming scenario, the temperature<br />
profile of Basel correlates well with today’s profile<br />
of Grono, with medium warming with today’s<br />
profile of Lugano, <strong>and</strong> with strong warming with<br />
today’s profile of Verona.<br />
However, with regard to such comparisons, one<br />
has to bear in mind that the problems of climate<br />
change are not primarily caused by the new climate<br />
state but rather by the process of change<br />
<strong>and</strong> the resulting problems of adaptation.<br />
Figure 6: Comparison of MeteoSwiss<br />
temperature curves for Zurich today<br />
<strong>and</strong> in <strong>2050</strong>, with today’s temperatures<br />
in Sion, Magadino <strong>and</strong> Torino,<br />
according to weak, medium <strong>and</strong><br />
strong warming scenarios.


