

Climate Change and Switzerland 2050 - OcCC - SCNAT
Climate Change and Switzerland 2050 - OcCC - SCNAT
Climate Change and Switzerland 2050 - OcCC - SCNAT

You also want an ePaper? Increase the reach of your titles
YUMPU automatically turns print PDFs into web optimized ePapers that Google loves.
<strong>Climate</strong> <strong>Change</strong> <strong>and</strong> Switzerl<strong>and</strong> <strong>2050</strong> | Background 19<br />
a)<br />
Altitude [m]<br />
2000<br />
1500<br />
1000<br />
500<br />
0<br />
1960 1970 1980 1990<br />
Year<br />
DJF<br />
2000<br />
1500<br />
1000<br />
Altitude [m] 2000<br />
500<br />
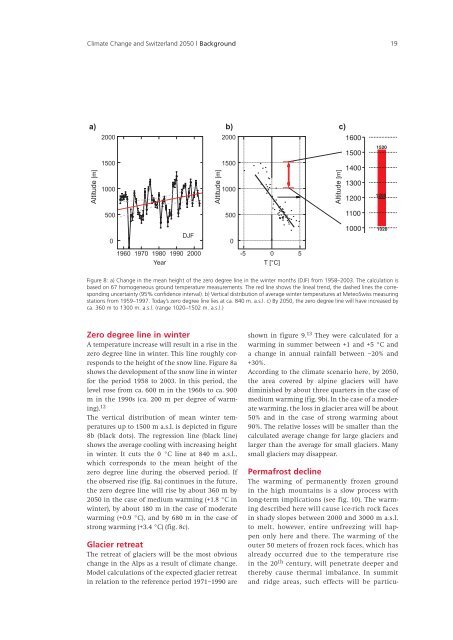
Zero degree line in winter<br />
A temperature increase will result in a rise in the<br />
zero degree line in winter. This line roughly corresponds<br />
to the height of the snow line. Figure 8a<br />
shows the development of the snow line in winter<br />
for the period 1958 to 2003. In this period, the<br />
level rose from ca. 600 m in the 1960s to ca. 900<br />
m in the 1990s (ca. 200 m per degree of warming).<br />
12<br />
The vertical distribution of mean winter temperatures<br />
up to 1500 m a.s.l. is depicted in figure<br />
8b (black dots). The regression line (black line)<br />
shows the average cooling with increasing height<br />
in winter. It cuts the 0 °C line at 840 m a.s.l.,<br />
which corresponds to the mean height of the<br />
zero degree line during the observed period. If<br />
the observed rise (fig. 8a) continues in the future,<br />
the zero degree line will rise by about 360 m by<br />
<strong>2050</strong> in the case of medium warming (+1.8 °C in<br />
winter), by about 180 m in the case of moderate<br />
warming (+0.9 °C), <strong>and</strong> by 680 m in the case of<br />
strong warming (+3.4 °C) (fig. 8c).<br />
Glacier retreat<br />
The retreat of glaciers will be the most obvious<br />
change in the Alps as a result of climate change.<br />
Model calculations of the expected glacier retreat<br />
in relation to the reference period 1971–1990 are<br />
b)<br />
0<br />
-5 0 5<br />
T [°C]<br />
Altitude [m]<br />
shown in figure 9. 13 They were calculated for a<br />
warming in summer between +1 <strong>and</strong> +5 °C <strong>and</strong><br />
a change in annual rainfall between –20% <strong>and</strong><br />
+30%.<br />
According to the climate scenario here, by <strong>2050</strong>,<br />
the area covered by alpine glaciers will have<br />
diminished by about three quarters in the case of<br />
medium warming (fig. 9b). In the case of a moderate<br />
warming, the loss in glacier area will be about<br />
50% <strong>and</strong> in the case of strong warming about<br />
90%. The relative losses will be smaller than the<br />
calculated average change for large glaciers <strong>and</strong><br />
larger than the average for small glaciers. Many<br />
small glaciers may disappear.<br />
Permafrost decline<br />
The warming of permanently frozen ground<br />
in the high mountains is a slow process with<br />
long-term implications (see fig. 10). The warming<br />
described here will cause ice-rich rock faces<br />
in shady slopes between 2000 <strong>and</strong> 3000 m a.s.l.<br />
to melt, however, entire unfreezing will happen<br />
only here <strong>and</strong> there. The warming of the<br />
outer 50 meters of frozen rock faces, which has<br />
already occurred due to the temperature rise<br />
in the 20 th century, will penetrate deeper <strong>and</strong><br />
thereby cause thermal imbalance. In summit<br />
<strong>and</strong> ridge areas, such effects will be particu-<br />
c)<br />
1600<br />
1500<br />
1400<br />
1300<br />
1200<br />
1100<br />
1520<br />
1200<br />
1000 1020<br />
Figure 8: a) <strong>Change</strong> in the mean height of the zero degree line in the winter months (DJF) from 1958–2003. The calculation is<br />
based on 67 homogeneous ground temperature measurements. The red line shows the lineal trend, the dashed lines the corresponding<br />
uncertainty (95% confidence interval). b) Vertical distribution of average winter temperatures at MeteoSwiss measuring<br />
stations from 1959–1997. Today’s zero degree line lies at ca. 840 m. a.s.l. c) By <strong>2050</strong>, the zero degree line will have increased by<br />
ca. 360 m to 1300 m. a.s.l. (range 1020–1502 m. a.s.l.)


