"INDUCED POLARIZATION DATA AT ... - University of Utah
"INDUCED POLARIZATION DATA AT ... - University of Utah
"INDUCED POLARIZATION DATA AT ... - University of Utah

You also want an ePaper? Increase the reach of your titles
YUMPU automatically turns print PDFs into web optimized ePapers that Google loves.
CHU<br />
pore solution. This value is thought to reflect the contribution <strong>of</strong><br />
clays to the IP effect. Qv can be determined independently from the<br />
ratio <strong>of</strong> cation exchange capacity <strong>of</strong> the core sample (meq) to the pore<br />
volume <strong>of</strong> the sample (ml). The cation exchange capacity, CEC, in meq<br />
per 100gm <strong>of</strong> the rock sample, was measured by atomic absorption<br />
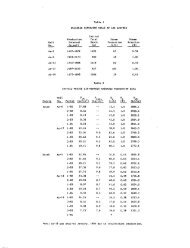
spectrometry. A summary <strong>of</strong> the measurements is given in Table 1.<br />
Both Qv and porosity depend upon the volume <strong>of</strong> interconnected pore<br />
passages within the rock. For non-expanding core samples, the pore<br />
volume was taken to be the volume <strong>of</strong> water absorbed by the rock after<br />
the two to three month soaking period. For samples which expanded [(c)<br />
and (f) <strong>of</strong> Table 1J, the pore volume was assumed to be the difference<br />
between the volume <strong>of</strong> water absorbed and the change in volume <strong>of</strong> the<br />
core sample. This latter procedure may have resulted in inflated QV<br />
values; but if the former procedure had been followed, the QV values for<br />
the expanded samples (c) and (f) would have been 1.34 equiv/l and 2.22<br />
equiv/l respectively, which are still larger than the Qv values for the<br />
non-expanded samples.<br />
The porosity (effective porosity) was determined from the ratio <strong>of</strong><br />
the pore volume <strong>of</strong> the sample to the volume <strong>of</strong> the rock when wet.<br />
Data Interpretation<br />
Ten samples were prepared. Two <strong>of</strong> the samples were slightly<br />
hydrothermally altered, while another two were inadequately<br />
encapsulated. The remaining six samples were highly altered, and the<br />
data for these are shown in Table 1 and Figures 2a-2f.<br />
Effects <strong>of</strong> temperature. - The resistivity <strong>of</strong> the altered rocks is