"INDUCED POLARIZATION DATA AT ... - University of Utah
"INDUCED POLARIZATION DATA AT ... - University of Utah
"INDUCED POLARIZATION DATA AT ... - University of Utah

Create successful ePaper yourself
Turn your PDF publications into a flip-book with our unique Google optimized e-Paper software.
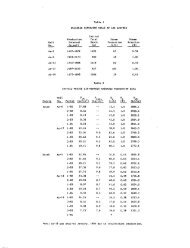
FIG. 5. Schematic explanation <strong>of</strong> temperature effect on phase spectrum for<br />
sample (b) <strong>of</strong> Figure 2b. Heavy lines denote frequency range <strong>of</strong> lab data. The<br />
drop in resistivity as temperature rises, shown by the resistivity plot,<br />
causes the phase spectrum to shift to a higher frequency; thus one may be able<br />
to gain more information on the phase behavior at low frequencies by<br />
increasing temperature.<br />
CHU