Chapter 4 Vortex detection - Computer Graphics and Visualization
Chapter 4 Vortex detection - Computer Graphics and Visualization
Chapter 4 Vortex detection - Computer Graphics and Visualization

You also want an ePaper? Increase the reach of your titles
YUMPU automatically turns print PDFs into web optimized ePapers that Google loves.
<strong>Chapter</strong> 6. Applications<br />
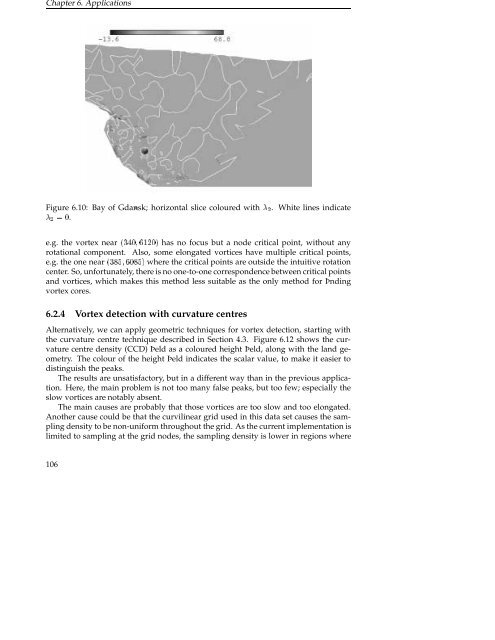
Figure 6.10: Bay of Gda«nsk; horizontal slice coloured with . White lines indicate<br />
.<br />
e.g. the vortex near has no focus but a node critical point, without any<br />
rotational component. Also, some elongated vortices have multiple critical points,<br />
e.g. the one near where the critical points are outside the intuitive rotation<br />
center. So, unfortunately, there is no one-to-one correspondence between critical points<br />
<strong>and</strong> vortices, which makes this method less suitable as the only method for Þnding<br />
vortex cores.<br />
6.2.4 <strong>Vortex</strong> <strong>detection</strong> with curvature centres<br />
Alternatively, we can apply geometric techniques for vortex <strong>detection</strong>, starting with<br />
the curvature centre technique described in Section 4.3. Figure 6.12 shows the curvature<br />
centre density (CCD) Þeld as a coloured height Þeld, along with the l<strong>and</strong> geometry.<br />
The colour of the height Þeld indicates the scalar value, to make it easier to<br />
distinguish the peaks.<br />
The results are unsatisfactory, but in a different way than in the previous application.<br />
Here, the main problem is not too many false peaks, but too few; especially the<br />
slow vortices are notably absent.<br />
The main causes are probably that those vortices are too slow <strong>and</strong> too elongated.<br />
Another cause could be that the curvilinear grid used in this data set causes the sampling<br />
density to be non-uniform throughout the grid. As the current implementation is<br />
limited to sampling at the grid nodes, the sampling density is lower in regions where<br />
106