Chapter 4 Vortex detection - Computer Graphics and Visualization
Chapter 4 Vortex detection - Computer Graphics and Visualization
Chapter 4 Vortex detection - Computer Graphics and Visualization

Create successful ePaper yourself
Turn your PDF publications into a flip-book with our unique Google optimized e-Paper software.
¯ vortex rotation direction: ×Ò «Û<br />
¯ vortex angular velocity: ¡Ø<br />
4.5. The winding-angle method<br />
È <br />
Ð «ÛÐ<br />
<strong>Visualization</strong> of the vortices can be accomplished by mapping their attributes to icons:<br />
the first three attributes are mapped to an ellipse. The angular velocity is visualized<br />
by adding wheel spokes to the ellipse, the number of which is made proportional to<br />
the angular velocity: fast rotation is suggested by many spokes, slow rotation by few.<br />
Finally, the rotation direction of a vortex is visualized by arrow heads.<br />
4.5.2 Example<br />
To test this method, we use the same flow past the tapered cylinder as in Section 4.1.<br />
First, we apply the winding-angle method to select streamlines from six slices in various<br />
z-planes, to show varying patterns. The selection criteria are: «Û <strong>and</strong><br />
ÑÜ× .<br />
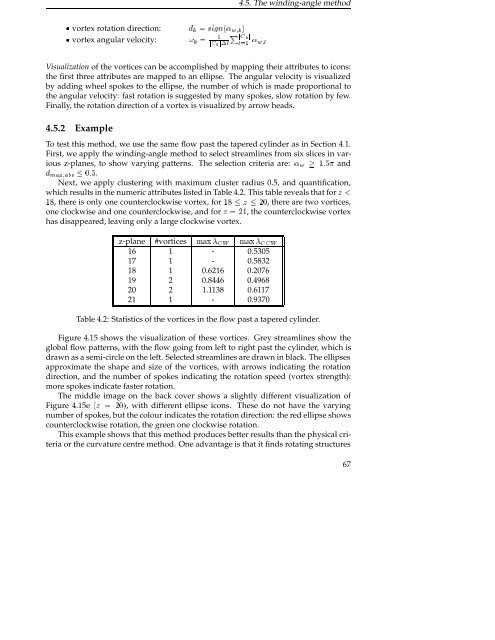
Next, we apply clustering with maximum cluster radius 0.5, <strong>and</strong> quantification,<br />
which results in the numeric attributes listed in Table 4.2. This table reveals that for Þ<br />
, there is only one counterclockwise vortex, for Þ , there are two vortices,<br />
one clockwise <strong>and</strong> one counterclockwise, <strong>and</strong> for Þ , the counterclockwise vortex<br />
has disappeared, leaving only a large clockwise vortex.<br />
z-plane #vortices ÑÜ Ï ÑÜ Ï<br />
16 1 - 0.5305<br />
17 1 - 0.5832<br />
18 1 0.6216 0.2076<br />
19 2 0.8446 0.4968<br />
20 2 1.1138 0.6117<br />
21 1 - 0.9370<br />
Table 4.2: Statistics of the vortices in the flow past a tapered cylinder.<br />
Figure 4.15 shows the visualization of these vortices. Grey streamlines show the<br />
global flow patterns, with the flow going from left to right past the cylinder, which is<br />
drawn as a semi-circle on the left. Selected streamlines are drawn in black. The ellipses<br />
approximate the shape <strong>and</strong> size of the vortices, with arrows indicating the rotation<br />
direction, <strong>and</strong> the number of spokes indicating the rotation speed (vortex strength):<br />
more spokes indicate faster rotation.<br />
The middle image on the back cover shows a slightly different visualization of<br />
Figure 4.15e Þ , with different ellipse icons. These do not have the varying<br />
number of spokes, but the colour indicates the rotation direction: the red ellipse shows<br />
counterclockwise rotation, the green one clockwise rotation.<br />
This example shows that this method produces better results than the physical criteria<br />
or the curvature centre method. One advantage is that it finds rotating structures<br />
67