Chapter 4 Vortex detection - Computer Graphics and Visualization
Chapter 4 Vortex detection - Computer Graphics and Visualization
Chapter 4 Vortex detection - Computer Graphics and Visualization

You also want an ePaper? Increase the reach of your titles
YUMPU automatically turns print PDFs into web optimized ePapers that Google loves.
<strong>Chapter</strong> 1. Introduction<br />
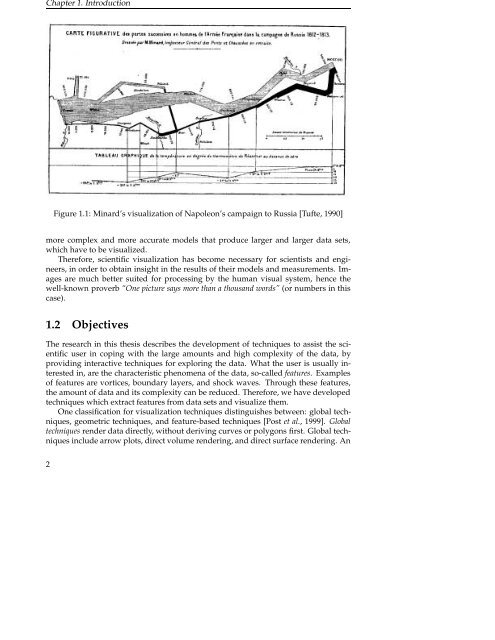
Figure 1.1: Minard’s visualization of Napoleon’s campaign to Russia [Tufte, 1990]<br />
more complex <strong>and</strong> more accurate models that produce larger <strong>and</strong> larger data sets,<br />
which have to be visualized.<br />
Therefore, scientific visualization has become necessary for scientists <strong>and</strong> engineers,<br />
in order to obtain insight in the results of their models <strong>and</strong> measurements. Images<br />
are much better suited for processing by the human visual system, hence the<br />
well-known proverb “One picture says more than a thous<strong>and</strong> words” (or numbers in this<br />
case).<br />
1.2 Objectives<br />
The research in this thesis describes the development of techniques to assist the scientific<br />
user in coping with the large amounts <strong>and</strong> high complexity of the data, by<br />
providing interactive techniques for exploring the data. What the user is usually interested<br />
in, are the characteristic phenomena of the data, so-called features. Examples<br />
of features are vortices, boundary layers, <strong>and</strong> shock waves. Through these features,<br />
the amount of data <strong>and</strong> its complexity can be reduced. Therefore, we have developed<br />
techniques which extract features from data sets <strong>and</strong> visualize them.<br />
One classification for visualization techniques distinguishes between: global techniques,<br />
geometric techniques, <strong>and</strong> feature-based techniques [Post et al., 1999]. Global<br />
techniques render data directly, without deriving curves or polygons first. Global techniques<br />
include arrow plots, direct volume rendering, <strong>and</strong> direct surface rendering. An<br />
2