Chapter 4 Vortex detection - Computer Graphics and Visualization
Chapter 4 Vortex detection - Computer Graphics and Visualization
Chapter 4 Vortex detection - Computer Graphics and Visualization

Create successful ePaper yourself
Turn your PDF publications into a flip-book with our unique Google optimized e-Paper software.
3.3. Particle tracing in -transformed grids<br />
coordinates are defined relative to the local water elevation <strong>and</strong> depth , as <br />
Þ <br />
.<br />
The top layer, where , follows the free water surface, which usually only varies<br />
gradually. The bottom layer, where , follows the sea bed geometry, which typically<br />
has strongly varying depths throughout the model. The layers in between have a<br />
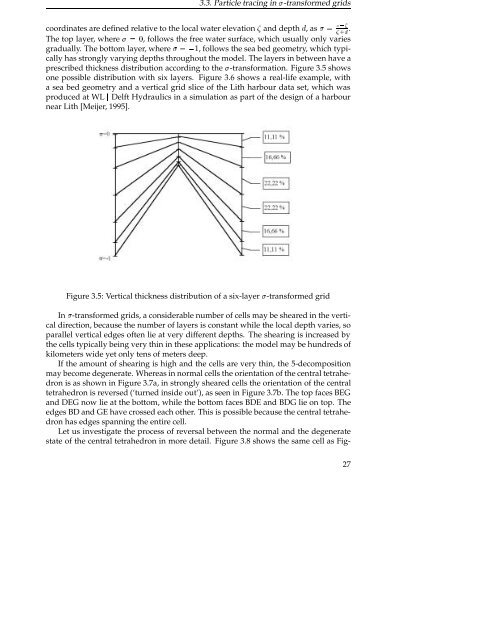
prescribed thickness distribution according to the -transformation. Figure 3.5 shows<br />
one possible distribution with six layers. Figure 3.6 shows a real-life example, with<br />
a sea bed geometry <strong>and</strong> a vertical grid slice of the Lith harbour data set, which was<br />
produced at WL Delft Hydraulics in a simulation as part of the design of a harbour<br />
near Lith [Meijer, 1995].<br />
Figure 3.5: Vertical thickness distribution of a six-layer -transformed grid<br />
In -transformed grids, a considerable number of cells may be sheared in the vertical<br />
direction, because the number of layers is constant while the local depth varies, so<br />
parallel vertical edges often lie at very different depths. The shearing is increased by<br />
the cells typically being very thin in these applications: the model may be hundreds of<br />
kilometers wide yet only tens of meters deep.<br />
If the amount of shearing is high <strong>and</strong> the cells are very thin, the 5-decomposition<br />
may become degenerate. Whereas in normal cells the orientation of the central tetrahedron<br />
is as shown in Figure 3.7a, in strongly sheared cells the orientation of the central<br />
tetrahedron is reversed (‘turned inside out’), as seen in Figure 3.7b. The top faces BEG<br />
<strong>and</strong> DEG now lie at the bottom, while the bottom faces BDE <strong>and</strong> BDG lie on top. The<br />
edges BD <strong>and</strong> GE have crossed each other. This is possible because the central tetrahedron<br />
has edges spanning the entire cell.<br />
Let us investigate the process of reversal between the normal <strong>and</strong> the degenerate<br />
state of the central tetrahedron in more detail. Figure 3.8 shows the same cell as Fig-<br />
27