Tips for Learners of Evidence-Based Medicine
Tips for Learners of Evidence-Based Medicine
Tips for Learners of Evidence-Based Medicine

You also want an ePaper? Increase the reach of your titles
YUMPU automatically turns print PDFs into web optimized ePapers that Google loves.
culated using a statistical program called StatsDirect (available<br />
commercially through www.statsdirect.com). You can<br />
see that in some instances we intuitively overestimated or<br />
underestimated the intervals relative to those we derived<br />
using the statistical <strong>for</strong>mulas.<br />
The bottom line<br />
Confidence intervals in<strong>for</strong>m clinicians about the range<br />
within which the true treatment effect might plausibly lie,<br />
given the trial data. Greater precision (narrower confidence<br />
intervals) results from larger sample sizes and consequent<br />
larger number <strong>of</strong> events. Statisticians (and statistical s<strong>of</strong>tware)<br />
can calculate 95% confidence intervals around any<br />
estimate <strong>of</strong> treatment effect.<br />
Tip 2: Interpreting<br />
confidence intervals<br />
You should now have an understanding<br />
<strong>of</strong> the relation between the<br />
width <strong>of</strong> the confidence interval<br />
around a measure <strong>of</strong> outcome in a<br />
clinical trial and the number <strong>of</strong> participants<br />
and events in that study.<br />
You are ready to consider whether a<br />
study is sufficiently large, and the resulting<br />
confidence intervals sufficiently<br />
narrow, to reach a definitive<br />
conclusion about recommending the<br />
therapy, after taking into account<br />
your patient’s values, preferences and<br />
circumstances.<br />
The concept <strong>of</strong> a minimally important<br />
treatment effect proves useful<br />
in considering the issue <strong>of</strong> when a<br />
study is large enough and has there<strong>for</strong>e<br />
generated confidence intervals<br />
that are narrow enough to recommend<br />
<strong>for</strong> or against the therapy. This<br />
concept requires the clinician to<br />
think about the smallest amount <strong>of</strong><br />
benefit that would justify therapy.<br />
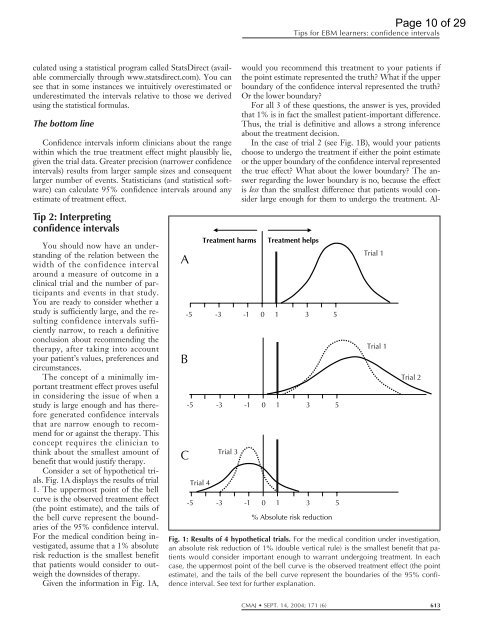
Consider a set <strong>of</strong> hypothetical trials.<br />
Fig. 1A displays the results <strong>of</strong> trial<br />
1. The uppermost point <strong>of</strong> the bell<br />
curve is the observed treatment effect<br />
(the point estimate), and the tails <strong>of</strong><br />
the bell curve represent the boundaries<br />
<strong>of</strong> the 95% confidence interval.<br />
For the medical condition being investigated,<br />
assume that a 1% absolute<br />
risk reduction is the smallest benefit<br />
that patients would consider to outweigh<br />
the downsides <strong>of</strong> therapy.<br />
Given the in<strong>for</strong>mation in Fig. 1A,<br />
A<br />
B<br />
C<br />
-5<br />
-5<br />
Trial 4<br />
Treatment harms<br />
-3<br />
-3<br />
Trial 3<br />
<strong>Tips</strong> <strong>for</strong> EBM learners: confidence intervals<br />
would you recommend this treatment to your patients if<br />
the point estimate represented the truth? What if the upper<br />
boundary <strong>of</strong> the confidence interval represented the truth?<br />
Or the lower boundary?<br />
For all 3 <strong>of</strong> these questions, the answer is yes, provided<br />
that 1% is in fact the smallest patient-important difference.<br />
Thus, the trial is definitive and allows a strong inference<br />
about the treatment decision.<br />
In the case <strong>of</strong> trial 2 (see Fig. 1B), would your patients<br />
choose to undergo the treatment if either the point estimate<br />
or the upper boundary <strong>of</strong> the confidence interval represented<br />
the true effect? What about the lower boundary? The answer<br />
regarding the lower boundary is no, because the effect<br />
is less than the smallest difference that patients would consider<br />
large enough <strong>for</strong> them to undergo the treatment. Al-<br />
-1<br />
-1<br />
-5 -3 -1 0<br />
Treatment helps<br />
0 1 3 5<br />
0 1 3 5<br />
1 3 5<br />
% Absolute risk reduction<br />
Trial 1<br />
Trial 1<br />
Page 10 <strong>of</strong> 29<br />
Trial 2<br />
Fig. 1: Results <strong>of</strong> 4 hypothetical trials. For the medical condition under investigation,<br />
an absolute risk reduction <strong>of</strong> 1% (double vertical rule) is the smallest benefit that patients<br />
would consider important enough to warrant undergoing treatment. In each<br />
case, the uppermost point <strong>of</strong> the bell curve is the observed treatment effect (the point<br />
estimate), and the tails <strong>of</strong> the bell curve represent the boundaries <strong>of</strong> the 95% confidence<br />
interval. See text <strong>for</strong> further explanation.<br />
CMAJ SEPT. 14, 2004; 171 (6) 613