Tips for Learners of Evidence-Based Medicine
Tips for Learners of Evidence-Based Medicine
Tips for Learners of Evidence-Based Medicine

Create successful ePaper yourself
Turn your PDF publications into a flip-book with our unique Google optimized e-Paper software.
Montori et al<br />
Tip 2: Prevalence, spectrum and test<br />
characteristics<br />
You may have learned the rule <strong>of</strong> thumb that post-test<br />
probabilities (which are closely related to predictive values)<br />
vary with disease prevalence, but sensitivities, specificities<br />
and likelihood ratios do not. Is this true? The answer is<br />
“yes,” provided that disease spectrum remains the same in<br />
high- and low-prevalence populations. In the discussion<br />
that follows, <strong>for</strong> purposes <strong>of</strong> simplicity, we use the term<br />
“prevalence” to denote the likelihood that any patient randomly<br />
selected from the study population has the disease or<br />
condition as defined by the criterion standard. This is not<br />
the same thing as the probability <strong>of</strong> disease in any individual<br />
patient.<br />
Referring once again to Fig. 1, let’s consider 3 cases. In<br />
the first, we’ll assume that there were 1000 patients in each<br />
subgroup: 1000 in whom congestive heart failure was unequivocally<br />
the cause <strong>of</strong> their dyspnea and 1000 in whom<br />
asthma was almost certainly the cause. The prevalence <strong>of</strong><br />
congestive heart failure is 50%. Each bell curve corresponds<br />
to the distribution <strong>of</strong> BNP values within the respec-<br />
A Pregnant Not pregnant Total<br />
Positive<br />
test result<br />
Negative<br />
test result<br />
A<br />
C<br />
95<br />
5<br />
388 JAMC 16 AOÛT 2005; 173 (4)<br />
B<br />
D<br />
1 96<br />
99 104<br />
Total 100 100 200<br />
B<br />
Positive<br />
test result<br />
Negative<br />
test result<br />
A × 4<br />
C × 4<br />
380<br />
20<br />
B<br />
D<br />
1 381<br />
99 119<br />
Total 400 100 500<br />
C<br />
Positive<br />
test result<br />
Negative<br />
test result<br />
A<br />
C<br />
95<br />
5<br />
B × 4<br />
D × 4<br />
4 99<br />
396 401<br />
Total 100 400 500<br />
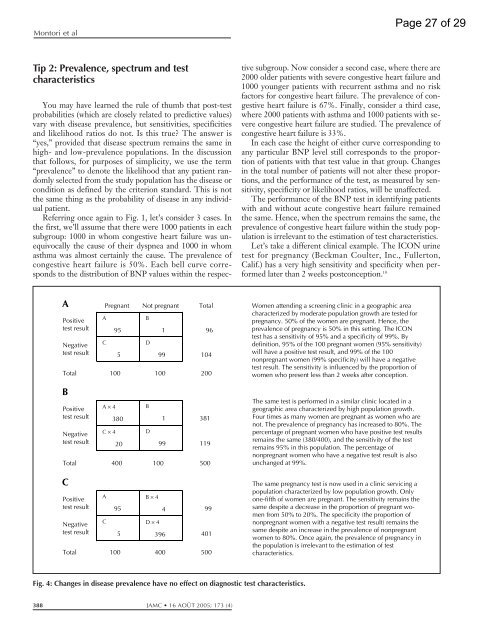
Fig. 4: Changes in disease prevalence have no effect on diagnostic test characteristics.<br />
tive subgroup. Now consider a second case, where there are<br />
2000 older patients with severe congestive heart failure and<br />
1000 younger patients with recurrent asthma and no risk<br />
factors <strong>for</strong> congestive heart failure. The prevalence <strong>of</strong> congestive<br />
heart failure is 67%. Finally, consider a third case,<br />
where 2000 patients with asthma and 1000 patients with severe<br />
congestive heart failure are studied. The prevalence <strong>of</strong><br />
congestive heart failure is 33%.<br />
In each case the height <strong>of</strong> either curve corresponding to<br />
any particular BNP level still corresponds to the proportion<br />
<strong>of</strong> patients with that test value in that group. Changes<br />
in the total number <strong>of</strong> patients will not alter these proportions,<br />
and the per<strong>for</strong>mance <strong>of</strong> the test, as measured by sensitivity,<br />
specificity or likelihood ratios, will be unaffected.<br />
The per<strong>for</strong>mance <strong>of</strong> the BNP test in identifying patients<br />
with and without acute congestive heart failure remained<br />
the same. Hence, when the spectrum remains the same, the<br />
prevalence <strong>of</strong> congestive heart failure within the study population<br />
is irrelevant to the estimation <strong>of</strong> test characteristics.<br />
Let’s take a different clinical example. The ICON urine<br />
test <strong>for</strong> pregnancy (Beckman Coulter, Inc., Fullerton,<br />
Calif.) has a very high sensitivity and specificity when per<strong>for</strong>med<br />
later than 2 weeks postconception. 10<br />
Women attending a screening clinic in a geographic area<br />
characterized by moderate population growth are tested <strong>for</strong><br />
pregnancy. 50% <strong>of</strong> the women are pregnant. Hence, the<br />
prevalence <strong>of</strong> pregnancy is 50% in this setting. The ICON<br />
test has a sensitivity <strong>of</strong> 95% and a specificity <strong>of</strong> 99%. By<br />
definition, 95% <strong>of</strong> the 100 pregnant women (95% sensitivity)<br />
will have a positive test result, and 99% <strong>of</strong> the 100<br />
nonpregnant women (99% specificity) will have a negative<br />
test result. The sensitivity is influenced by the proportion <strong>of</strong><br />
women who present less than 2 weeks after conception.<br />
The same test is per<strong>for</strong>med in a similar clinic located in a<br />
geographic area characterized by high population growth.<br />
Four times as many women are pregnant as women who are<br />
not. The prevalence <strong>of</strong> pregnancy has increased to 80%. The<br />
percentage <strong>of</strong> pregnant women who have positive test results<br />
remains the same (380/400), and the sensitivity <strong>of</strong> the test<br />
remains 95% in this population. The percentage <strong>of</strong><br />
nonpregnant women who have a negative test result is also<br />
unchanged at 99%.<br />
The same pregnancy test is now used in a clinic servicing a<br />
population characterized by low population growth. Only<br />
one-fifth <strong>of</strong> women are pregnant. The sensitivity remains the<br />
same despite a decrease in the proportion <strong>of</strong> pregnant women<br />
from 50% to 20%. The specificity (the proportion <strong>of</strong><br />
nonpregnant women with a negative test result) remains the<br />
same despite an increase in the prevalence <strong>of</strong> nonpregnant<br />
women to 80%. Once again, the prevalence <strong>of</strong> pregnancy in<br />
the population is irrelevant to the estimation <strong>of</strong> test<br />
characteristics.<br />
Page 27 <strong>of</strong> 29