Tips for Learners of Evidence-Based Medicine
Tips for Learners of Evidence-Based Medicine
Tips for Learners of Evidence-Based Medicine

You also want an ePaper? Increase the reach of your titles
YUMPU automatically turns print PDFs into web optimized ePapers that Google loves.
acute congestive heart failure are both much closer to the<br />
middle <strong>of</strong> the range. The extent <strong>of</strong> the overlap <strong>of</strong> the curves<br />
between points A and B is much greater, which means that<br />
there is residual uncertainty about the disease status <strong>of</strong> a<br />
large proportion <strong>of</strong> the patients even after the BNP test has<br />
been per<strong>for</strong>med.<br />
It may be helpful to note that the sensitivity <strong>of</strong> the BNP<br />
test at a cut<strong>of</strong>f value <strong>of</strong> 100 pg/mL (the proportion <strong>of</strong> patients<br />
with acute congestive heart failure whose BNP level<br />
is greater than 100 pg/mL) is defined in Fig. 1 and Fig. 2 as<br />
the percentage <strong>of</strong> the total area <strong>of</strong> the right-hand curve that<br />
lies to the right <strong>of</strong> the cut<strong>of</strong>f value. Notice that this percentage<br />
is markedly lower in Fig. 2 than in Fig. 1. The<br />
same is true <strong>of</strong> specificity, which is the proportion <strong>of</strong> patients<br />
without acute congestive heart failure whose BNP<br />
level is less than 100 pg/mL. This is defined in the figures<br />
as the proportion <strong>of</strong> the left-hand curve that lies to the left<br />
<strong>of</strong> the cut<strong>of</strong>f point. Again this percentage is appreciably<br />
lower in Fig. 2 compared with Fig. 1.<br />
These theoretical concerns play out (albeit with a lesser<br />
magnitude <strong>of</strong> impact than depicted in Fig. 1and Fig. 2) in<br />
studies <strong>of</strong> the BNP test as a diagnostic tool. In the BNP<br />
study to which we have referred, the sensitivity and specificity<br />
<strong>of</strong> the test using the 100 pg/mL cut-<strong>of</strong>f were 90%<br />
and 76% respectively when all patients were included. 4<br />
Only about 25% <strong>of</strong> the study population were judged by<br />
the treating physicians to be in the intermediate range <strong>of</strong><br />
probability <strong>of</strong> acute congestive heart failure. 5 When only<br />
patients in this subgroup were considered in a number <strong>of</strong><br />
studies, the sensitivity and specificity <strong>of</strong> the BNP test at a<br />
cut<strong>of</strong>f point <strong>of</strong> 100 pg/mL were only 88% and 55% respectively.<br />
7<br />
The range <strong>of</strong> disease states found among the patients<br />
in the population upon which a test is to be used is commonly<br />
referred to as “disease spectrum.” In making your<br />
final assessment on the value <strong>of</strong> a test,<br />
consider the spectrum <strong>of</strong> the disease or<br />
condition in which you are interested.<br />
You don’t need to differentiate healthy<br />
patients from patients with severe disease.<br />
Rather, you must differentiate<br />
those who have the disease from those<br />
who do not among all those who appear<br />
as if they might have it. The “right”<br />
population <strong>for</strong> a diagnostic test study includes<br />
(1) those in whom we are uncertain<br />
<strong>of</strong> the diagnosis; (2) those in whom<br />
we will use the test in clinical practice to<br />
resolve our uncertainty; and (3) patients<br />
with the disease who have a wide spectrum<br />
<strong>of</strong> severity and patients without the<br />
disease who have symptoms commonly<br />
associated with it.<br />
Readers familiar with the concept and<br />
interpretation <strong>of</strong> likelihood ratios <strong>for</strong> diagnostic<br />
test results 1 may find it useful to<br />
Proportion <strong>of</strong> patients<br />
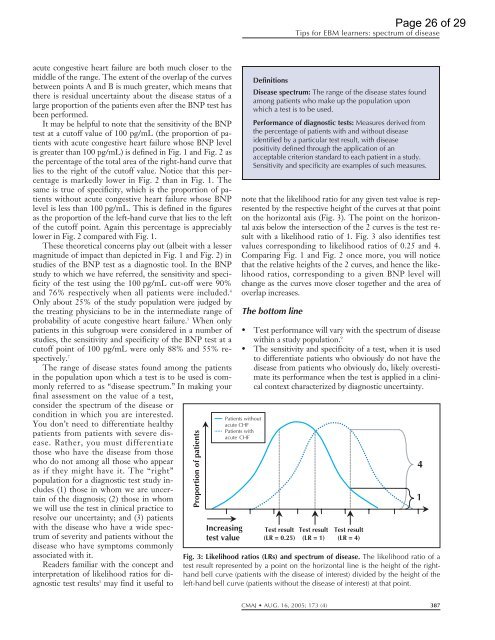
note that the likelihood ratio <strong>for</strong> any given test value is represented<br />
by the respective height <strong>of</strong> the curves at that point<br />
on the horizontal axis (Fig. 3). The point on the horizontal<br />
axis below the intersection <strong>of</strong> the 2 curves is the test result<br />
with a likelihood ratio <strong>of</strong> 1. Fig. 3 also identifies test<br />
values corresponding to likelihood ratios <strong>of</strong> 0.25 and 4.<br />
Comparing Fig. 1and Fig. 2 once more, you will notice<br />
that the relative heights <strong>of</strong> the 2 curves, and hence the likelihood<br />
ratios, corresponding to a given BNP level will<br />
change as the curves move closer together and the area <strong>of</strong><br />
overlap increases.<br />
The bottom line<br />
<strong>Tips</strong> <strong>for</strong> EBM learners: spectrum <strong>of</strong> disease<br />
• Test per<strong>for</strong>mance will vary with the spectrum <strong>of</strong> disease<br />
within a study population. 9<br />
• The sensitivity and specificity <strong>of</strong> a test, when it is used<br />
to differentiate patients who obviously do not have the<br />
disease from patients who obviously do, likely overestimate<br />
its per<strong>for</strong>mance when the test is applied in a clinical<br />
context characterized by diagnostic uncertainty.<br />
Patients without<br />
acute CHF<br />
Patients with<br />
acute CHF<br />
Increasing<br />
test value<br />
Definitions<br />
Disease spectrum: The range <strong>of</strong> the disease states found<br />
among patients who make up the population upon<br />
which a test is to be used.<br />
Per<strong>for</strong>mance <strong>of</strong> diagnostic tests: Measures derived from<br />
the percentage <strong>of</strong> patients with and without disease<br />
identified by a particular test result, with disease<br />
positivity defined through the application <strong>of</strong> an<br />
acceptable criterion standard to each patient in a study.<br />
Sensitivity and specificity are examples <strong>of</strong> such measures.<br />
Test result<br />
(LR = 0.25)<br />
Test result<br />
(LR = 1)<br />
Test result<br />
(LR = 4)<br />
Page 26 <strong>of</strong> 29<br />
Fig. 3: Likelihood ratios (LRs) and spectrum <strong>of</strong> disease. The likelihood ratio <strong>of</strong> a<br />
test result represented by a point on the horizontal line is the height <strong>of</strong> the righthand<br />
bell curve (patients with the disease <strong>of</strong> interest) divided by the height <strong>of</strong> the<br />
left-hand bell curve (patients without the disease <strong>of</strong> interest) at that point.<br />
CMAJ AUG. 16, 2005; 173 (4) 387<br />
4<br />
1